• Journal of Geo-information Science
  • Vol. 22, Issue 1, 100 (2020)
Qingfeng GUAN1、1, Shuliang REN1、1, Yao YAO1、1、2、2、*, Xun LIANG1、1, Jianfeng ZHOU1、1, Zehao YUAN1、1, and Liangyang DAI1、1
Author Affiliations
  • 1School of Geography and Information Engineering, China University of Geosciences, Wuhan 430078, China
  • 1中国地质大学(武汉)地理与信息工程学院,武汉 430078
  • 2Alibaba Group, Hangzhou 311121, China
  • 2阿里巴巴集团,杭州 311121
  • show less
    DOI: 10.12082/dqxxkx.2020.190406 Cite this Article
    Qingfeng GUAN, Shuliang REN, Yao YAO, Xun LIANG, Jianfeng ZHOU, Zehao YUAN, Liangyang DAI. Revealing the Behavioral Patterns of Different Socioeconomic Groups in Cities with Mobile Phone Data and House Price Data[J]. Journal of Geo-information Science, 2020, 22(1): 100 Copy Citation Text show less
    Study area of Shenzhen city of Guangdong Province
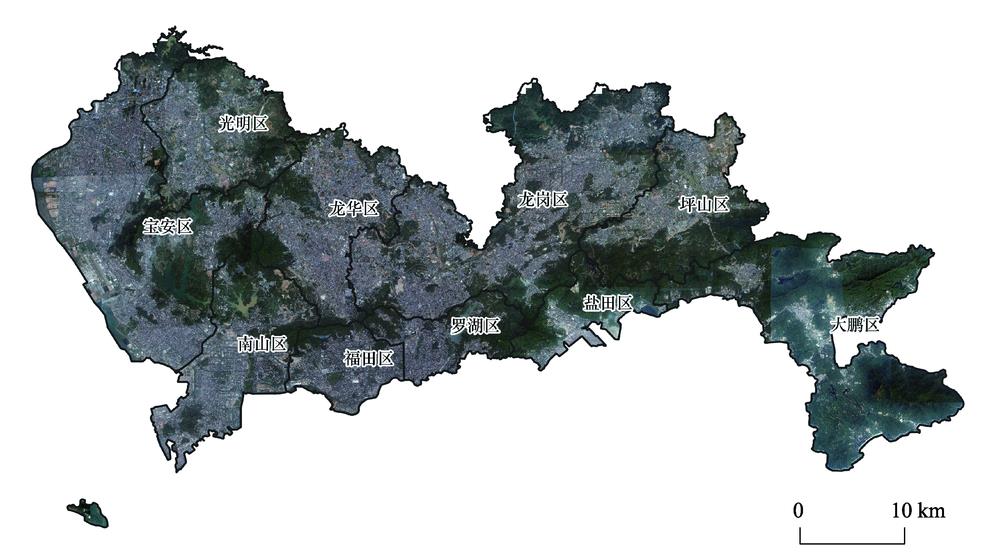
    Fig. 1. Study area of Shenzhen city of Guangdong Province
    Service area of mobile phone towers in Shenzhen in 2013
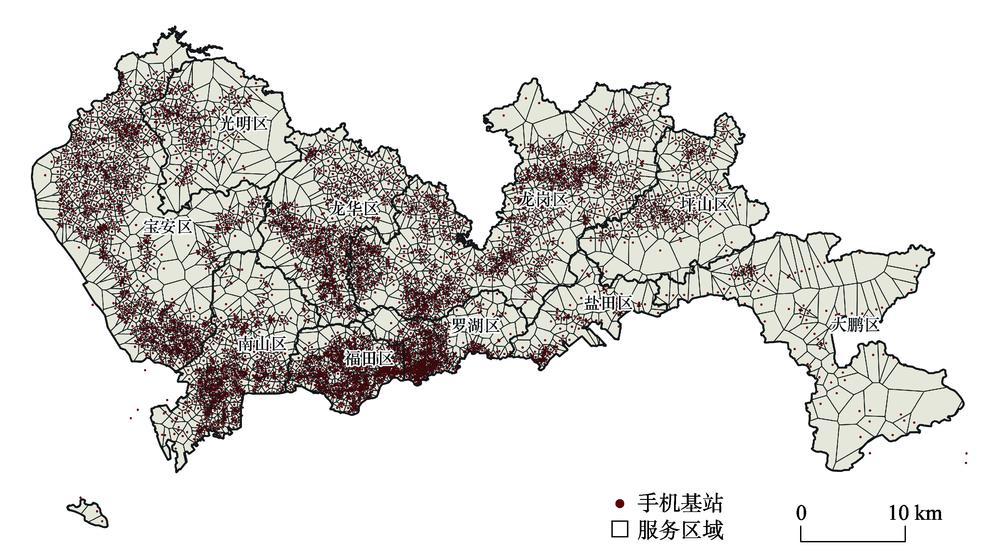
    Fig. 2. Service area of mobile phone towers in Shenzhen in 2013
    Housing prices mapping of Shenzhen in 2017 with a 5 m resolution
    Fig. 3. Housing prices mapping of Shenzhen in 2017 with a 5 m resolution
    Framework of analyzing the behavioral patterns of people at different economic levels with mobile phone data and house price data
    Fig. 4. Framework of analyzing the behavioral patterns of people at different economic levels with mobile phone data and house price data
    Histogram of the ratio between the within-cell standard deviation and overall deviation of housing price at the level of cellphone tower service areas in Shenzhen
    Fig. 5. Histogram of the ratio between the within-cell standard deviation and overall deviation of housing price at the level of cellphone tower service areas in Shenzhen
    Dividing the population of different economic levels based on housing prices in Shenzhen
    Fig. 6. Dividing the population of different economic levels based on housing prices in Shenzhen
    Spatial distribution of activity points of people at different economic levels in Shenzhen
    Fig. 7. Spatial distribution of activity points of people at different economic levels in Shenzhen
    Boxplots of activity indicators for different economic levels in Shenzhen
    Fig. 8. Boxplots of activity indicators for different economic levels in Shenzhen
    Density distribution of the moment of inertia of all Shenzhen phone users
    Fig. 9. Density distribution of the moment of inertia of all Shenzhen phone users
    Spatial distribution of the moment of inertia of all Shenzhen phone users
    Fig. 10. Spatial distribution of the moment of inertia of all Shenzhen phone users
    Moment of inertia of peoples in Shenzhen per economic levels
    Fig. 11. Moment of inertia of peoples in Shenzhen per economic levels
    Boxplots of travel indicators for people with different economic levels in Shenzhen
    Fig. 12. Boxplots of travel indicators for people with different economic levels in Shenzhen
    Spatial Distribution of commuter velocity of people at different economic levels in Shenzhen
    Fig. 13. Spatial Distribution of commuter velocity of people at different economic levels in Shenzhen
    用户id记录次数记录时刻记录位置记录时刻
    f5d4a*******02052220120323 00:01:32114.18** 22.64**20120323 01:28:39
    0bdf1*******91cb2420120322 23:30:13114.21** 22.60**20120323 00:30:15
    1db81*******adf32320120322 23:25:37114.21** 22.60**20120323 00:09:29
    4cdd3*******49a3920120323 12:53:30114.09** 22.73**20120323 02:27:50
    556df*******439c2220120322 23:23:27114.21** 22.60**20120323 00:26:04
    5790f*******c9701420120323 10:55:40114.35** 22.70**20120323 11:26:35
    Table 1. Examples of mobile phone location records
    经济水平居家时间工作时间生活娱乐时间活动点数量惯性矩活动熵出行时间出行距离职住距离出行速度
    1.0001.0000.9420.9870.6250.9820.9340.8310.6740.581
    中低0.9960.9940.9390.9860.6920.9820.9570.8630.7200.839
    0.9880.9860.9660.9990.7800.9990.9840.8980.8840.896
    中高0.9650.9550.9891.0000.7781.0001.0000.9240.9430.934
    0.9430.9451.0000.9991.0000.9980.9971.0001.0001.000
    Table 2. Comparison of activity indicators for people with different economic levels in Shenzhen
    Qingfeng GUAN, Shuliang REN, Yao YAO, Xun LIANG, Jianfeng ZHOU, Zehao YUAN, Liangyang DAI. Revealing the Behavioral Patterns of Different Socioeconomic Groups in Cities with Mobile Phone Data and House Price Data[J]. Journal of Geo-information Science, 2020, 22(1): 100
    Download Citation