Pengfei Liu, Lan Jiang, Sumei Wang, Zhitao Cao, Peng Wang. Temperature-insensitive refractive index sensor based on an optical fiber extrinsic Fabry–Perot interferometer processed by a femtosecond laser[J]. Chinese Optics Letters, 2016, 14(2): 020602
Copy Citation Text
An optical fiber extrinsic Fabry–Perot interferometer (EFPI) is designed and fabricated for refractive index (RI) sensing. To test the RI of liquid, the following two different methods are adopted: the wavelength tracking method and the Fourier-transform white-light interferometry (FTWLI). The sensitivities of sensors with cavity lengths of 288.1 and 358.5 μm are 702.312 nm/RIU and 396.362 μm/RIU, respectively, by the two methods. Our work provides a new kind of RI sensor with the advantages of high sensitivity, mechanical robustness, and low cross sensitivity to temperature. Also, we provide a new method to deal with gold film with a femtosecond laser.
In recent years, many fiber sensors based on Fabry–Perot interferometers (FPIs) have been fabricated and used to measure different parameters such as refractive index (RI), humidity, temperature, and so on[1–6]. For example, an all-in-fiber prototype optofluidic device was fabricated by femtosecond laser irradiation and subsequent selective chemical wet etching. The optical Fabry–Perot cavity was formed for measurement of the RI of the filling liquids[1]. A fiber extrinsic FPI (EFPI) for humidity measurement based on a polyvinyl alcohol (PVA) film is proposed and experimentally demonstrated[2]. Also, a small air gap between the end face of a single-mode fiber and an ultrathin graphene was used as an EFPI cavity for temperature measurement[3]. Furthermore, the EFPI shown in Ref. [4] was used for pressure sensing with a sensitivity of 10.18 nm/kPa.
For RI sensing, a lot of different kinds of fiber sensors based on different principles have been developed, such as a Michelson interferometer (MI)[7,8], long period fiber gratings (LPFG)[9,10], and a Mach–Zehnder interferometer (MZI)[11,12]. As for the FPI, some sandwich-structured Fabry–Perot sensors that use a short section of a different type of fiber, instead of the air cavity, exhibit superior performance[13]. However, rather poor optical performance was shown because of the small index difference between the two spliced fibers[5]. The FPI mentioned in Ref. [6] shows a high sensitivity in RI sensing, but it is difficult to make sure that the two reflective faces are fabricated by the femtosecond laser vertical to the axial direction of fiber because of trapezoid groove formed in laser fabrication. What is more, too much ablation deep into the fiber will cause fragility problems.
In this Letter, we propose a new EFPI-based RI sensor that is assembled by a silica glass capillary. Two different methods are adopted to test the RI of the liquid.
Sign up for Chinese Optics Letters TOC. Get the latest issue of Chinese Optics Letters delivered right to you!Sign up now
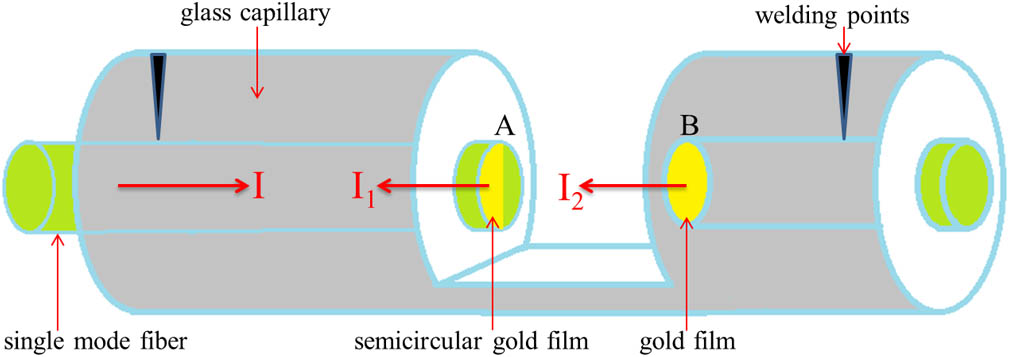
The proposed EFPI consists of two fiber end faces (A and B shown in Fig. 1) both coated with gold film by vacuum sputtering for about 80 s. Then, one of them is scanned by a femtosecond laser to remove half of its gold film, to form a semicircular gold film (A shown in Fig. 1). After that, the two fiber ends are assembled by a silica glass capillary with the outer diameter of 1.8 mm and inner diameter of 0.127 mm. The schematic diagram is shown in Fig. 1.
It is worth mentioning that the capillary has been ground by a diamond wheel to a depth about 1 mm on its side face ahead of time in order to expose its capillary channel so that we could let in different liquids to test the RI[14]. After the two fibers are inserted into the silica glass capillary channel, laser welding is adopted to bond the fibers and the capillary. For two different RI sensing experiments, we have prepared two FPIs with different cavity lengths, 288.1 and 358.5 μm, which mean two different distances between the two fiber end faces. The photos of the two fiber end faces and the whole assembly under the microscope are shown in Fig. 2.
Figure 2.Microscope images of the (a) fiber end face A, (b) fiber end face B, and (c) whole assembly.
When used to test the RI of a liquid, the proposed EFPI is connected to an interrogator (made by Jiang[15]) with a monitor displaying the optical spectrum and the other information. The light marked as I (shown in Fig. 1) from an amplified spontaneous emission (ASE) broadband source is injected into the single-mode fiber. Two different lights marked as and (shown in Fig. 1) reflected from gold film on faces A and B are collected. and generate an interference pattern just like a typical FPI, and the interference spectrum is shown on the monitor in real time. The optical path difference (OPD) between and affects the interference intensity and the relationship could be displayed by where is the initial phase of the interference (normally equal to zero), and is the optical wavelength in a vacuum[6]. The round-trip OPD of the EFPI is given by where is the RI of the tested liquid and is the cavity length in the vacuum.
According to Eq. (1), in the spectrum the crest wavelength will shift when OPD changes with the RI of the tested liquid. That is how the first method mentioned before works. Also, we could use the (FTWLI)[15] to demodulate the cavity length , which is one of the functions of the adopted interrogator[15]. The relationship between and could be shown as
According to Eqs. (2) and (3), we can easily get
From Eq. (3), there is a linear relationship between the demodulated and , and that is how the second method, called FTWLI, works for RI sensing. But it should be noted that both methods only work when is a constant, and that is already ensured because the proposed EFPI is all glass and bonded by laser welding to eliminate the influence of temperature on . However, our RI sensing experiments should still be carried out at constant temperature because temperature still has an influence on .
The central wavelength, pulse width, and repetition rate of the laser (Spectra-Physics, Inc.) used to remove half of the gold film are 800 nm, 35 fs, and 1 kHz, respectively, and the laser is focused on the fiber end face vertically by an objective lens (Olympus MPFLN ) with a NA of 0.45. The pulse energy used to process the end face is about 14 μJ. The experiment setup for the RI test is shown in Fig. 3.
The optical spectrum of the EFPI is obtained from 1522 to 1572 nm with a resolution of 1 pm. The typical EFPI spectrum is collected and displayed on the monitor, as shown in Fig. 4.
For the wavelength-tracking method, we choose the prepared EFPI with a cavity length of 288.1 μm. To test the RI of different liquids, we prepare 11 groups of NaCl solution with different concentration; 0% (distilled water), 1%, 2%…9%, and 10%. It should be noticed that the concentration “” means that there are grams of NaCl in 100 grams of NaCl solution. Different concentrations make different RI values for the NaCl solution. According to Ref. [16], for the concentration of 0%, 1%, 2%…9%, and 10%, we obtain different RI values of 1.3330, 1.3348, 1.3366, 1.3383, 1.3400, 1.3418, 1.3435, 1.3453, 1.3470, 1.3488, and 1.3505, respectively.
As shown in Fig. 3, droppers are used to drop the NaCl solution onto the groove of the silica glass capillary and to ensure that the cavity of the EFPI is filled with liquid. Every time that the liquid is dropped, we wait about two minutes for the spectrum to be stable and then we save the corresponding spectrum as a spreadsheet. After the spectrum is saved, absorbent paper is used to absorb the NaCl solution on the groove. Next, distilled water is used to wash away the residual NaCl solution and absorbent paper is used again to absorb distilled water. Finally, a small dryer is used to make sure the EFPI is dry, and then another new dropper is used to drop the NaCl solution of another different concentration. The routine described above is executed again and again until 11 groups of NaCl solution are all tested.
After those experiments are all done, we have collected 11 spreadsheets of spectrum. We put those spectra in one graph, and it appears a little complex because when the concentration of NaCl solution increases by 1%, the wavelength shifts too much over the free spectral range (FSR). To make it look clear, only six spectra (5%–10%) are shown in Fig. 5.
Figure 5.Spectra of the EFPI filled with a NaCl solution (5%–10%).
Part of the spectrum is selected using a red dashed line (as shown in Fig. 5) and amplified, as shown in Fig. 6. Although the wavelength shifts too much over the FSR, the redshift rule can still be found by a little patience and care. Actually, we only pick two spectra (5%, 6%) to draw the graph at first, so that we can see clearly how the wavelength shifts. Then, spectra of 7%, 8%, 9%, and 10% are added to the graph one by one to make the shifting rule be revealed step by step. Linear fitting is adopted to reveal the redshift rule, as shown in Fig. 7.
From Fig. 7, an RI sensitivity of 702.312 nm/RIU is acquired by a linear fit. Although the result of RI sensitivity is relatively high, there is still a problem for the method when the RI of the determinands changes in a large range. The wavelength shift is difficult to be determined as it shifts too much over the FSR when the concentration increases at a gradient of 1%. The wavelength tracking method is valid when the RI of the determinands changes in a small range.
Furthermore, we have adopted a longer cavity length (358.5 μm) for the wavelength tracking method and a relatively poor performance shows up with a very low fringe contrast of about 1 dBm, as shown in Fig. 8.
Figure 8.Spectrum of the sensor in water with a cavity length of 358.5 μm.
Although a slope of 1056.330 nm/RIU is obtained due to the longer cavity length, we still think that the long cavity length is not suitable for the wavelength tracking method because the rather low fringe contrast of 1 dBm is difficult to detect and is easily affected by ambient noise. What is more, the fringe contrast will continue to decrease if we use a longer cavity length until none of the useful interference spectrum shows up.
Due to all of those disadvantages of the wavelength tracking method, another method to test the RI sensitivity is applied for determinands with large RI variations.
Different from the wavelength tracking method used above, FTWLI is capable of providing both accuracy () and stability with a large dynamic measurement range[15]. The Fourier-transform algorithm has been built in the interrogator used in the RI sensing experiments.
Since short cavity length cannot be demodulated when FTWLI is adopted because short cavity length (< about 300 μm) will cause a relatively low frequency in the Fourier algorithm that cannot be captured, the EFPI with another relatively longer cavity length (358.5 μm) is used in the experiments. Different NaCl solutions with concentrations of 0%–10% are adopted again in the experiments. The only difference is that we no longer pay attention to the spectra this time, and the demodulated cavity length is recorded for 2 min every time that we drop a kind of NaCl solution and the cavity length is stable. It should be noted that the interrogator automatically records seven values of every ten seconds. So after 11 kinds of NaCl solution are all tested, we get 11 spreadsheets full of values of .
Since the numbers of values of are different in each spreadsheet, we select the last 81 values of of every spreadsheet and simply put them together in one graph, as shown in Fig. 10.
Figure 10. values of the demodulated cavity length .
To see clearly how the cavity length changes with the increase of RI, a linear fit is used again, as shown in Fig. 11. In Fig. 11, every black dot (11 in total) on the graph means the average of all of the values of in each spreadsheet. Here, for the abscissa of Fig. 11, we have already replaced the concentration by RI, since the RI of the NaCl solution is linearly dependent on its concentration, according to Ref. [16].
Figure 11.Cavity length variations versus RI for the EFPI.
As shown in Fig. 11, a good linear relation between cavity length and RI has been revealed, and the slope is about 396.362 μm/RIU. What is more, according to Eq. (3), in theory, the slope should equal the cavity length (358.5 μm), so the experimental result is in agreement with the theoretical one without regard to the error caused by the linear fit.
Finally, we study the influence of temperature on the cavity length using an EFPI with a cavity length of 630.7 μm. A thermostatic water bath is adopted in the experiment with an accuracy of 0.01°C. The EFPI is put in a sealed glass tube filled with air and the glass tube is submerged into a water tank filled with water, and then the EFPI is heated from 30°C to 60°C with a step of 5°C. The cavity length is recorded into a spreadsheet every time that the temperature is stable. Averages of all of the spreadsheets are calculated and plotted in Fig. 12 and linear fit shows a slope of 0.0306 μm/°C, then an ultra-low temperature cross sensitivity of is obtained according to calculation. Although temperature has not much influence on the cavity length , all of our RI sensing experiments are still operated at a constant room temperature of 20°C because temperature also influences the RI of the tested liquid due to the thermo-optical effect.
Figure 12.Cavity length variations versus temperature, from 30°C to 60°C.
In conclusion, we propose a new kind of EFPI made up of two single-mode fiber end faces, both coated with gold film, and one of them is then scanned by a femtosecond laser to remove half of its gold film to form a semicircular gold film. The whole structure is all glass and mechanically robust. Two methods are adopted in the RI sensing experiment at a constant room temperature of 20°C. The wavelength tracking method is simple and calculation-free, but only valid when the RI of the determinands changes in a small range and when a short cavity length is adopted. The FTWLI is of great accuracy but it is very complicated and calls for large amounts of calculation and is only valid when a longer cavity length (above about 300 μm) is adopted. The RI sensitivities are 702.312 nm/RIU and 396.362 μm/RIU, respectively, by the two methods. What is more, additional experiments show that the EFPI is temperature-insensitive. Our work provides a new way to deal with the gold film coated on optical fibers with the tool of a femtosecond laser.
Pengfei Liu, Lan Jiang, Sumei Wang, Zhitao Cao, Peng Wang. Temperature-insensitive refractive index sensor based on an optical fiber extrinsic Fabry–Perot interferometer processed by a femtosecond laser[J]. Chinese Optics Letters, 2016, 14(2): 020602