
Wenhao Wang, Yudong Tao, Jingui Ma, Jing Wang, Peng Yuan, Dongfang Zhang, Liejia Qian, "Parametric generation and phase locking of multiple sidebands in the regime of full-back-conversion," High Power Laser Sci. Eng. 11, 02000e21 (2023)
- High Power Laser Science and Engineering
- Vol. 11, Issue 2, 02000e21 (2023)
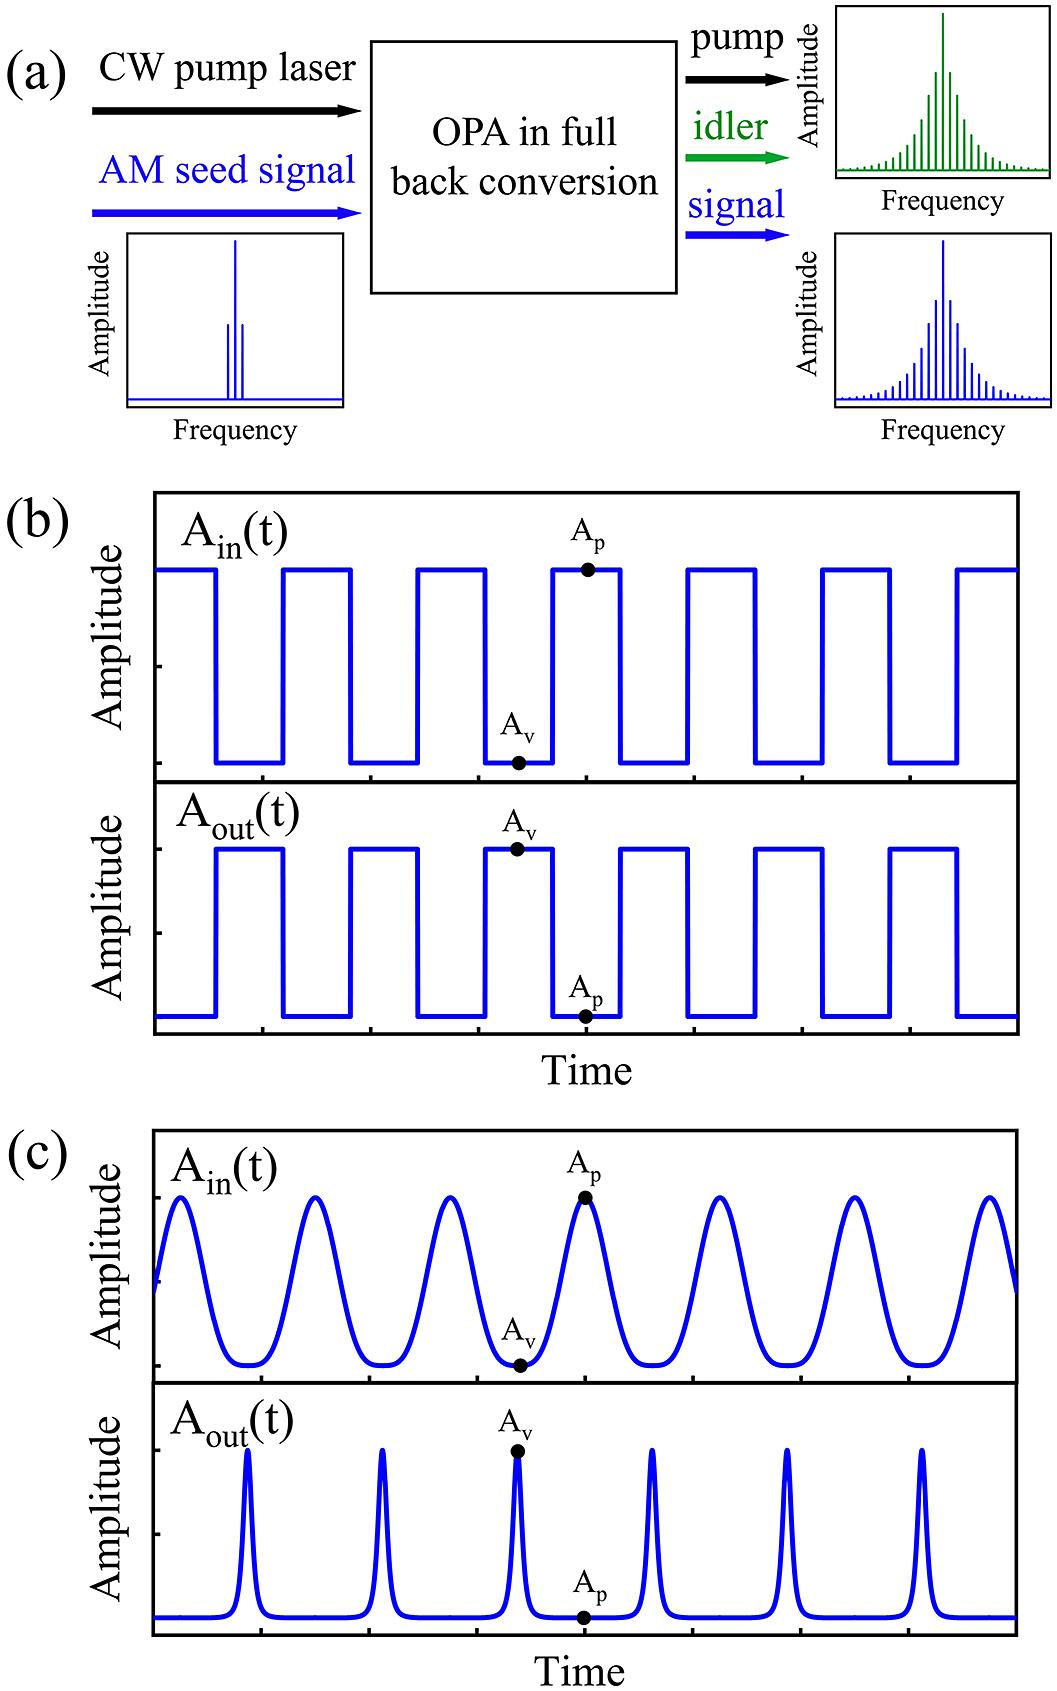
Fig. 1. (a) Schematic of a χ(2)-based optical modulator that provides a reciprocal-type transfer function. It consists of an OPA that is pumped by a quasi-continuous-wave laser and seeded by an amplitude-modulated (AM) laser. The output signal waveforms A out(t ) calculated for (b) a square-modulated seed signal A in(t ) and for (c) a sinusoidal AM seed signal A in(t ). Here, A p and A v denote the modulation peak and valley of a sinusoidal AM seed signal.

Fig. 2. (a) Amplitude evolution of the incident modulation peak (solid line) and valley (dotted line) versus the crystal length. (b) Amplitude evolution of the first five orders of sidebands A (n ), where n refers to the order for each sideband.
Fig. 3. (a) The amplitude (vertical lines) and phase (red circles) of each sideband for the pump, idler and signal calculated at various crystal lengths of (a) L = 0, (b) L = L p = 12.8 mm, (c) L = 14.5 mm and (d) L = 21.5 mm. The right-hand column presents the corresponding waveforms of the signal (blue solid line), pump (black solid line) and idler (green dashed line).
Fig. 4. (a) The output signal amplitude A out versus incident signal amplitude A in (blue), which agrees well with a reciprocal-type transfer function (red). The inset plots the incident (black) and output signal waveform calculated by numerical simulation (blue) and Equation (5) (red). (b) The spectrum of the output signal (blue) and the fitting based on Equation (10) . (c) The number of sidebands (with the relative amplitude ≥0.1) and the temporal duration of the output signal against the change of ER. (d) Stability of the output pulse duration and temporal contrast against the change of crystal length.
Fig. 5. (a) Temporal waveform and (b) power spectral density of the output pulse train calculated in the presence of PSF without (blue) and with bandpass filtering (red), respectively. Temporal waveform of the output pulse train calculated for (c) GVM si = 0 (black), 90 fs/mm (blue), 500 fs/mm (red) and (d) GVM sp = 0 (black), 800 fs/mm (blue), 1200 fs/mm (red). Other simulation parameters are set the same as in Figures 3(d) and 4(a) .


Set citation alerts for the article
Please enter your email address

© Copyright 2018-2021 | Chinese Laser Press. All Rights Reserved 沪ICP备15018463号-20