
Yao Lu, Hao Xiong, Yibo Huang, Qiang Wu, Jiwei Qi, Chongpei Pan, Jingjun Xu. Nonlinear harmonic generation of terahertz waves in a topological valley polaritonic microcavity[J]. Chinese Optics Letters, 2023, 21(8): 081901
- Chinese Optics Letters
- Vol. 21, Issue 8, 081901 (2023)
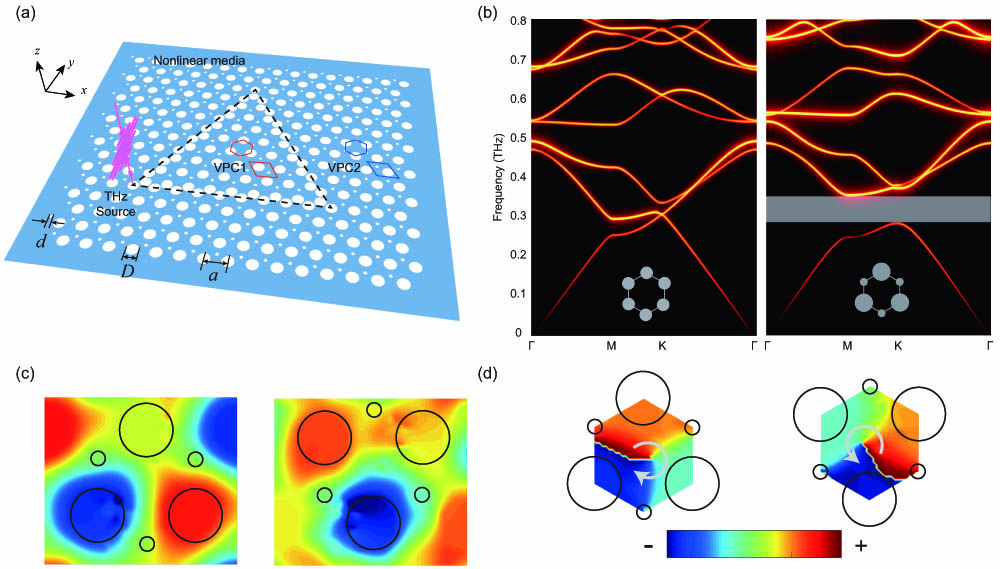
Fig. 1. Design of topological valley polaritonic microcavity and the edge modes. (a) Schematic design of the triangular valley microcavity with air holes etched in a dielectric material of linear susceptibility χ(1) = 25. The triangular topological edge is constructed by two different VPCs, which have different Chern numbers. A y-polarized THz source is placed at the left-bottom corner of the triangular microcavity. Lattice parameters are a = 150 µm, D = 80 µm, and d = 22.6 µm. (b) Energy bands of C6-symmetry photonic crystals (where D = d = 51.4 µm) and VPCs in subfigure (a). The C3-symmetric VPC breaks the Dirac point with a topological gap between 0.30 to 0.36 THz, scaled by the gray region. (c) Magnetic field (Hz) distribution in the two different VPCs. (d) Phase distribution of the Hz field shows different vortices in the two different VPCs.
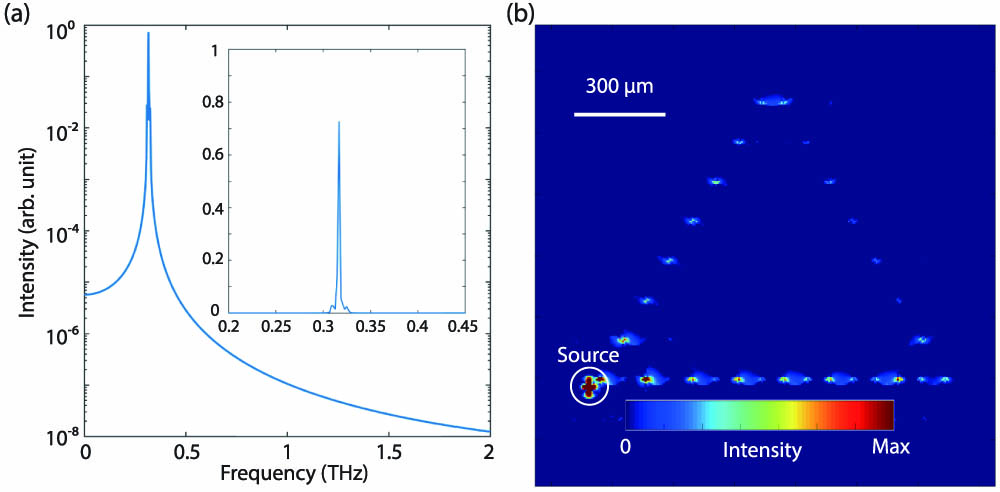
Fig. 2. Linear modes of the topological valley polaritonic microcavity (χ(1) = 25). (a) Mode distribution of the microcavity in the spectrum (logscale). The linear scale is shown in the inset. (b) Intensity distribution of field Ey in the microcavity.
Fig. 3. Nonlinear harmonic generation in the topological valley polaritonic microcavity (noncentrosymmetric materials, χ(1) = 25, χ(2) = 10−6 m/V). (a) Spectra in the microcavity excited by the different source powers (logscale). (b)–(i) Ey intensity distributions for the linear order to 8th-order harmonic waves, respectively (source amplitude is 5 × 10⁶ V/m).
Fig. 4. Nonlinear harmonic generation in the topological valley polaritonic microcavity (centrosymmetric materials, χ(1) = 25, χ(3) = 10−13 m2/V2). (a) Spectra in the microcavity excited by the different source powers (logscale). (b), (c) Ey intensity distributions of the excited mode and the triple-frequency mode, respectively (source amplitude is 3 × 10⁶ V/m).
Fig. 5. Topological robust properties against a unit-cell defect. (a) Diagram of the unit-cell defect. (b) and (c) The field distributions of the linear mode and the THG mode against the defect in centrosymmetric nonlinear materials, respectively. (d)–(f) The field distributions of linear, second-order, and third-order modes against the defect, respectively.

Set citation alerts for the article
Please enter your email address
© Copyright 2018-2021 | Chinese Laser Press. All Rights Reserved 沪ICP备15018463号-20