• Matter and Radiation at Extremes
  • Vol. 8, Issue 5, 058401 (2023)
Di Peng1、2、3、*, Qiaoshi Zeng1、4, Fujun Lan1, Zhenfang Xing1、5, Yang Ding1, and Ho-kwang Mao1、4
Author Affiliations
  • 1Center for High Pressure Science and Technology Advanced Research, Shanghai 201203, China
  • 2Key Laboratory of Materials Physics, Institute of Solid State Physics, HFIPS, Chinese Academy of Sciences, Hefei 230031, China
  • 3University of Science and Technology of China, Hefei 230026, China
  • 4Shanghai Key Laboratory of Material Frontiers Research in Extreme Environments (MFree), Shanghai Advanced Research in Physical Sciences (SHARPS), Shanghai 201203, China
  • 5State Key Laboratory of Superhard Materials, Institute of Physics, Jilin University, Changchun 130012, China
  • show less
    DOI: 10.1063/5.0166430 Cite this Article
    Di Peng, Qiaoshi Zeng, Fujun Lan, Zhenfang Xing, Yang Ding, Ho-kwang Mao. The near-room-temperature upsurge of electrical resistivity in Lu-H-N is not superconductivity, but a metal-to-poor-conductor transition[J]. Matter and Radiation at Extremes, 2023, 8(5): 058401 Copy Citation Text show less
    In situ electric resistance measurements of the Lu foil sample loaded with H2/N2 gas mixture in a DAC at 10 GPa and 295 K. The insets present optical micrographs of the Lu foil sample as loaded (left) and after a 5-day reaction (right), showing the four Pt electrodes. The metallic luster of the surface of the Lu foil sample changes to dark blue after 5 days of reaction. The colorful fringes are due to light interference between the gap from the sample to the diamond-anvil surface, which becomes invisible after reaction mainly due to much less light being reflected by the dark sample surface. The obvious consumption of H2/N2 gas mixture was reflected by sample-chamber shrinkage after 5 days of reaction. The sample size also slightly increased after the reaction. The blue and red curves show the temperature-dependent raw resistance values during warming from 2 K (10 K) to 300 K for the initial pure Lu metal before reaction and the same sample after reacting for 5 days at 10 GPa and 295 K, respectively.
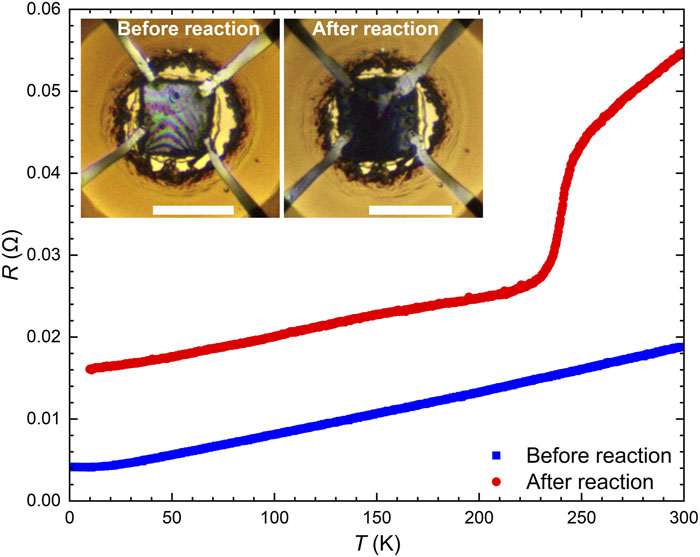
    Fig. 1. In situ electric resistance measurements of the Lu foil sample loaded with H2/N2 gas mixture in a DAC at 10 GPa and 295 K. The insets present optical micrographs of the Lu foil sample as loaded (left) and after a 5-day reaction (right), showing the four Pt electrodes. The metallic luster of the surface of the Lu foil sample changes to dark blue after 5 days of reaction. The colorful fringes are due to light interference between the gap from the sample to the diamond-anvil surface, which becomes invisible after reaction mainly due to much less light being reflected by the dark sample surface. The obvious consumption of H2/N2 gas mixture was reflected by sample-chamber shrinkage after 5 days of reaction. The sample size also slightly increased after the reaction. The blue and red curves show the temperature-dependent raw resistance values during warming from 2 K (10 K) to 300 K for the initial pure Lu metal before reaction and the same sample after reacting for 5 days at 10 GPa and 295 K, respectively.
    Di Peng, Qiaoshi Zeng, Fujun Lan, Zhenfang Xing, Yang Ding, Ho-kwang Mao. The near-room-temperature upsurge of electrical resistivity in Lu-H-N is not superconductivity, but a metal-to-poor-conductor transition[J]. Matter and Radiation at Extremes, 2023, 8(5): 058401
    Download Citation