
Qianjiao WU, Yumin CHEN. A Parallel Method of Surface Flow Dynamics Simulation based on CUDA [J]. Journal of Geo-information Science, 2020, 22(3): 505
- Journal of Geo-information Science
- Vol. 22, Issue 3, 505 (2020)
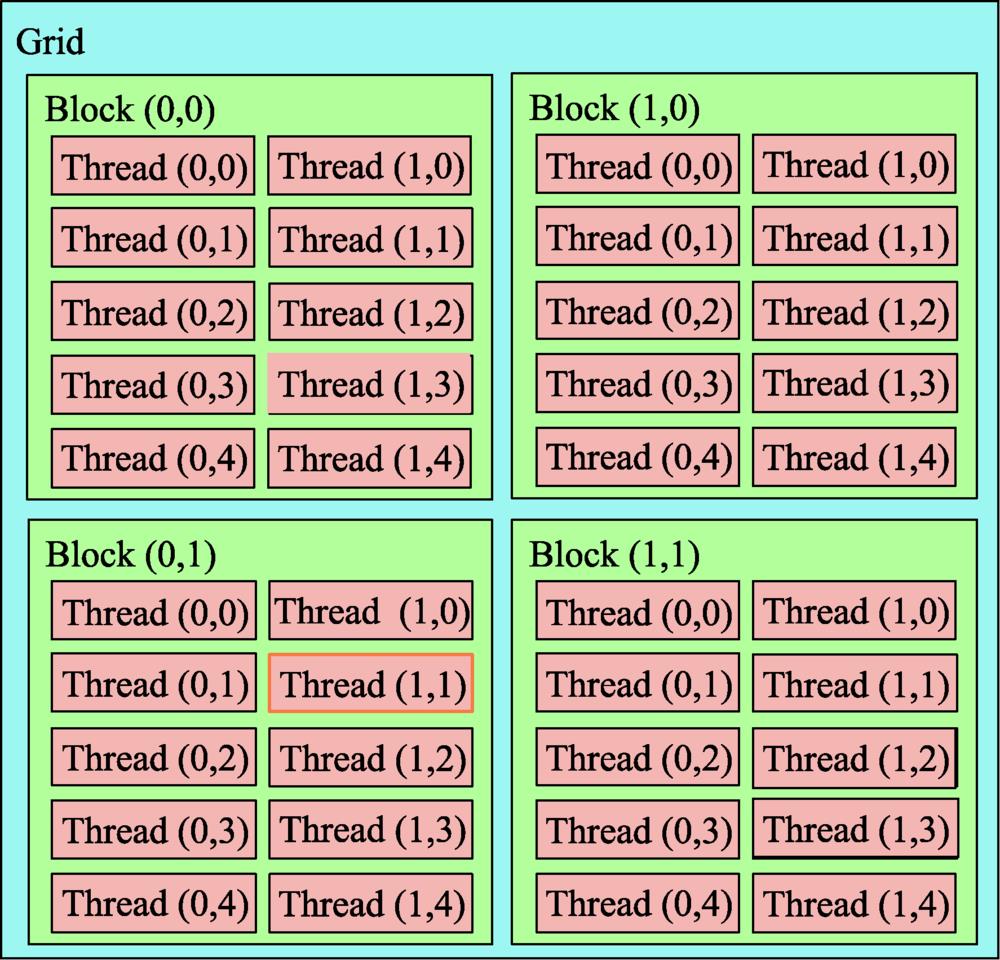
Fig. 1. Model of the threads by the CUDA
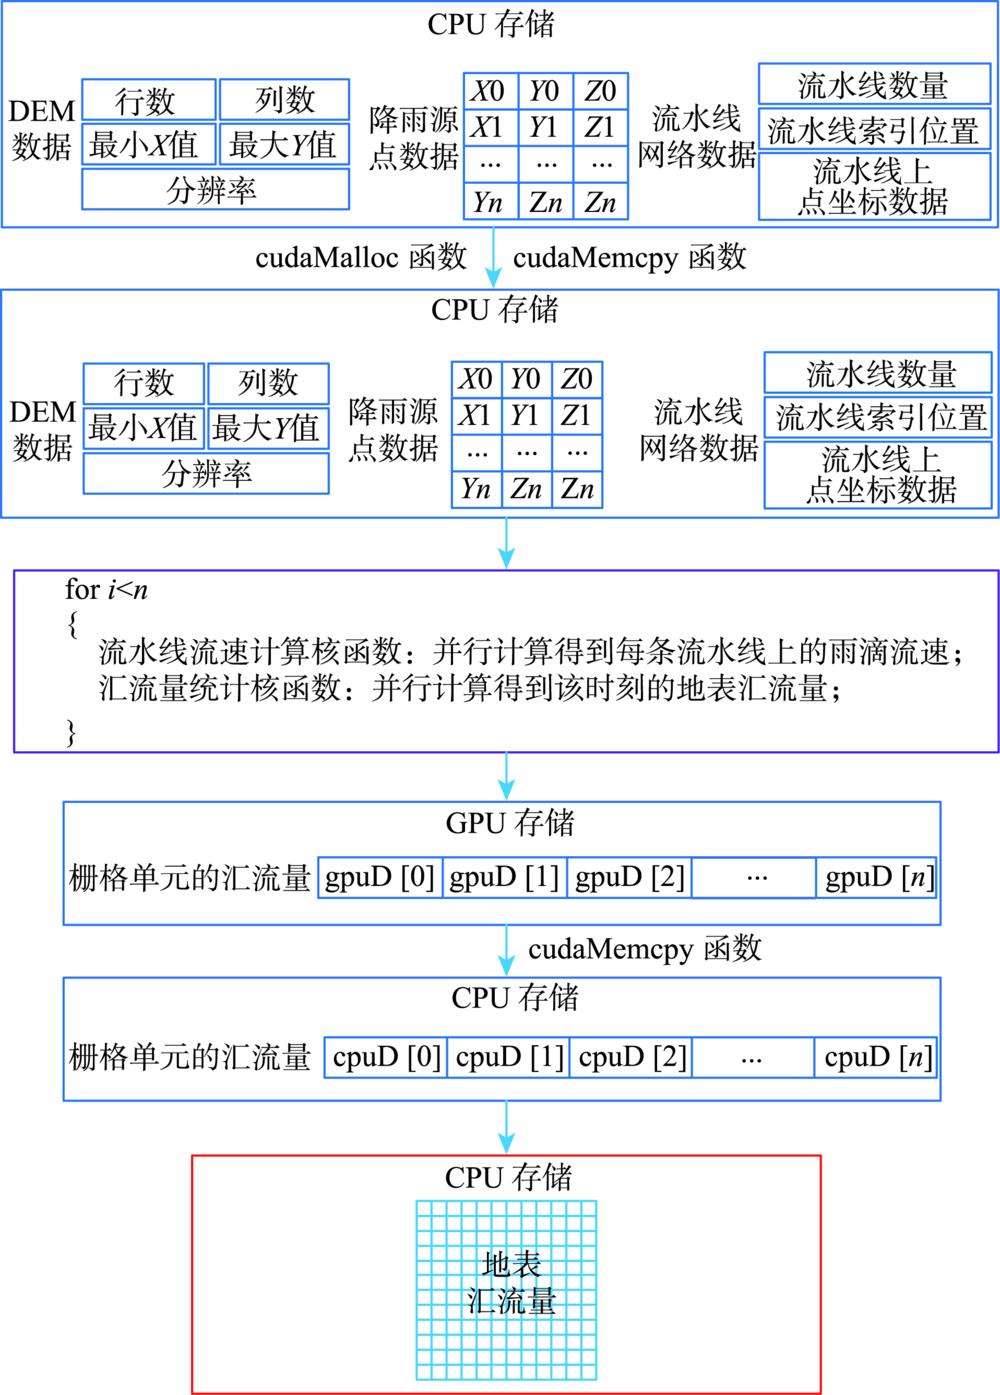
Fig. 2. Transmission mode of data during the parallelization process based on CUDA
Fig. 3. Partition model of thread during the parallelization process based on CUDA
Fig. 4. Test DEM of the BBW
Fig. 5. TINs on the sub-region under different thresholds
Fig. 6. Flow pathnetworks on the sub-region under different scales of the rainfall points (threshold is 0.5m)
Fig. 7. Comparison of the simulated results at the BBW's outlet
Fig. 8. Speed ratio under different scales of the rainfall points
Fig. 9. Nash coefficient distribution map of simulation results
Fig. 10. Correlation coefficient distribution map of simulation results
Fig. 11. Balance coefficient distribution map of simulation results
|
Table 1. The accuracy of TIN under different thresholds on the BBW
| ||||||||||||||||||||||||||||||||||||||||||||||||||||||||||||||||||||||||||||||||||||||||||||||||||||||||||||||||||||||||||||||||||||||||||||||||||||||||||||||||||||||||||||||||||||||||||||||||||||||||||||||||
Table 2. Accuracy comparison of simulating the flow discharge at the outlet of the BBW
| |||||||||||
Table 3. Statistical factors utilized to assess the precision of SWAT model (scale of DEM is 30 m)
| |||||||||||||||||||||||||||||||||||||||||||||||||||||||||||||||||||||||||||||
Table 4. Computation performance of simulating the flow discharge at the outlet of the BBW (s)


Set citation alerts for the article
Please enter your email address

© Copyright 2018-2021 | Chinese Laser Press. All Rights Reserved 沪ICP备15018463号-20