
Linling Luo, Xiaoqiu Ye, Guanghui Zhang, Huaqin Kou, Renjin Xiong, Ge Sang, Ronghai Yu, Dongliang Zhao. Enhancement of hydrogenation kinetics and thermodynamic properties of ZrCo1−xCrx (x = 0−0.1) alloys for hydrogen storage[J]. Chinese Physics B, 2020, 29(8):
- Chinese Physics B
- Vol. 29, Issue 8, (2020)
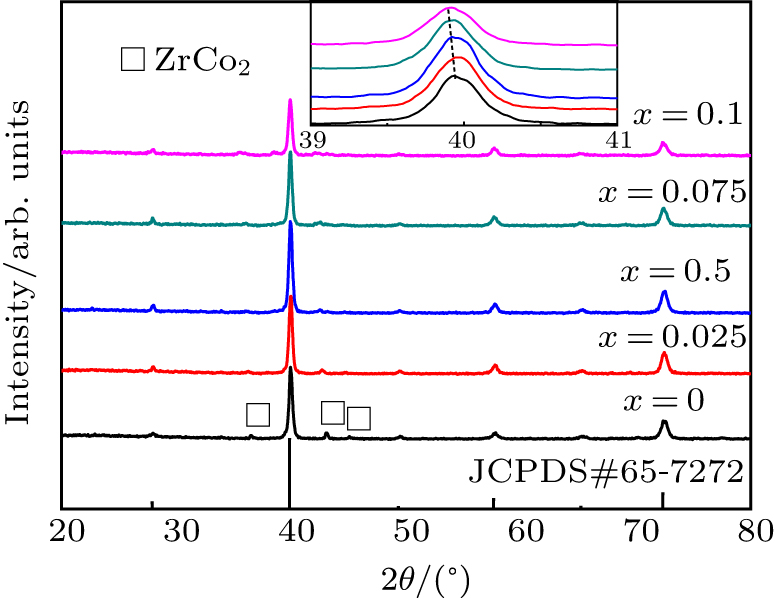
Fig. 1. XRD spectra of ZrCo1 − x Crx (x = 0−0.1) alloys.
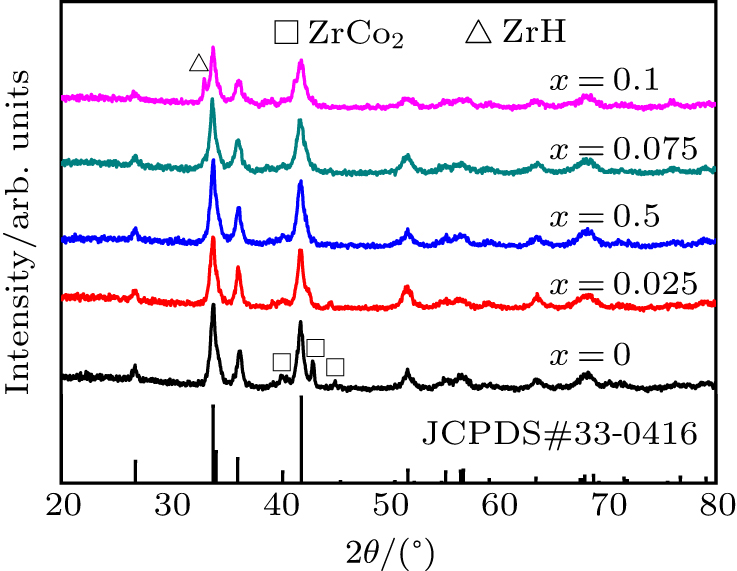
Fig. 2. XRD spectra of ZrCo1 − x Crx (x = 0−0.1)−H systems.
Fig. 3. EDS mappings of ZrCo0.95Cro0.05 alloy.
Fig. 4. First hydrogenation kinetics of ZrCo1 − x Crx (x = 0−0.1) alloys under 4-bar H2 at 348 K.
Fig. 5. Initial hydriding kinetic curves for ZrCo (a) and ZrCo0.95Cr0.05 (b) alloys at 323 K, 348 K, and 373 K.
Fig. 6. Plots of ln(−ln(1 − α )) versus ln t for the hydrogenation of ZrCo (a) and ZrCo0.95Cr0.05 (b) alloys.
Fig. 7. Plots of ln k versus 1000/T for the hydrogenation of ZrCo and ZrCo0.95Cr0.05 alloys.
Fig. 8. PCT curves of ZrCo1 − x Crx (x = 0−0.1)−H systems.
Fig. 9. Van’t Hoff curves for ZrCo1 − x Crx (x = 0−0.1)−H systems.
Fig. 10. Hydrogen pressure evolution of ZrCo1 − x Crx (x = 0−0.1)−H systems at 798 K insulated for 10 h.
Fig. 11. XRD patterns of disproportionation products of ZrCo1 − x Crx (x = 0−0.1) alloys.
Fig. 12. The isothermal disproportionation curves of ZrCo (a) and ZrCo0.95Cr0.05 (b) samples.
Fig. 13. Plots of ln(−ln(1 − α )) versus ln t for the disproportionation of ZrCo (a) and ZrCo0.95Cr0.05 (b) alloys at different temperatures.
Fig. 14. Plots of ln k versus 1000/T for the disproportionation of ZrCo and ZrCo0.95Cr0.05 alloys.
|
Table 1. Lattice parameters and cell volume of ZrCo phase in ZrCo1 − xCrx (x = 0−0.1) alloys.
|
Table 2. Average chemical composition (atom%) for ZrCo1 − xCrx (x = 0−0.1) alloys.
|
Table 3. Initial activation behaviors of ZrCo1 − xCrx (x = 0−0.1) alloys under 4-bar H2 at 348 K. Incubation period: the time needed to begin hydrogen absorption. Activation time: the time needed to reach 95% of saturated hydrogen capacity.
|
Table 4. Thermodynamic characteristics for hydrogen desorption of ZrCo1 − xCrx (x = 0−0.1)−H systems.
|
Table 5. Disproportionation behaviors of ZrCo1 − xCrx (x = 0−0.1)−H systems at 798 K insulated for 10 h. Absorbed pressure is the change in hydrogen pressure of activation process at room temperature.

Set citation alerts for the article
Please enter your email address
© Copyright 2018-2021 | Chinese Laser Press. All Rights Reserved 沪ICP备15018463号-20