• Chinese Journal of Lasers
  • Vol. 46, Issue 11, 1111001 (2019)
Xue Yang1, Dan Zhang2、3, Anmin Chen2、3、*, Suyu Li2、3, Yuanfei Jiang2、3, and Mingxing Jin2、3、**
Author Affiliations
  • 1College of Science, Jilin Institute of Chemical Technology, Jilin, Jilin 132022, China
  • 2Institute of Atomic and Molecular Physics, Jilin University, Changchun, Jilin 130012, China
  • 3Jilin Provincial Key Laboratory of Applied Atomic and Molecular Spectroscopy (Jilin University),Changchun, Jilin 130012, China
  • show less
    DOI: 10.3788/CJL201946.1111001 Cite this Article Set citation alerts
    Xue Yang, Dan Zhang, Anmin Chen, Suyu Li, Yuanfei Jiang, Mingxing Jin. Influence of Distance Between Focusing Lens and Sample Surface on Atomic Line and Ionic Line Intensities of Laser-Induced Silicon Plasmas[J]. Chinese Journal of Lasers, 2019, 46(11): 1111001 Copy Citation Text show less
    Schematics. (a) Experimental setup for analyzing influence of LTSD on spectral intensity in LIBS;(b) relationship between sample location and LTSD
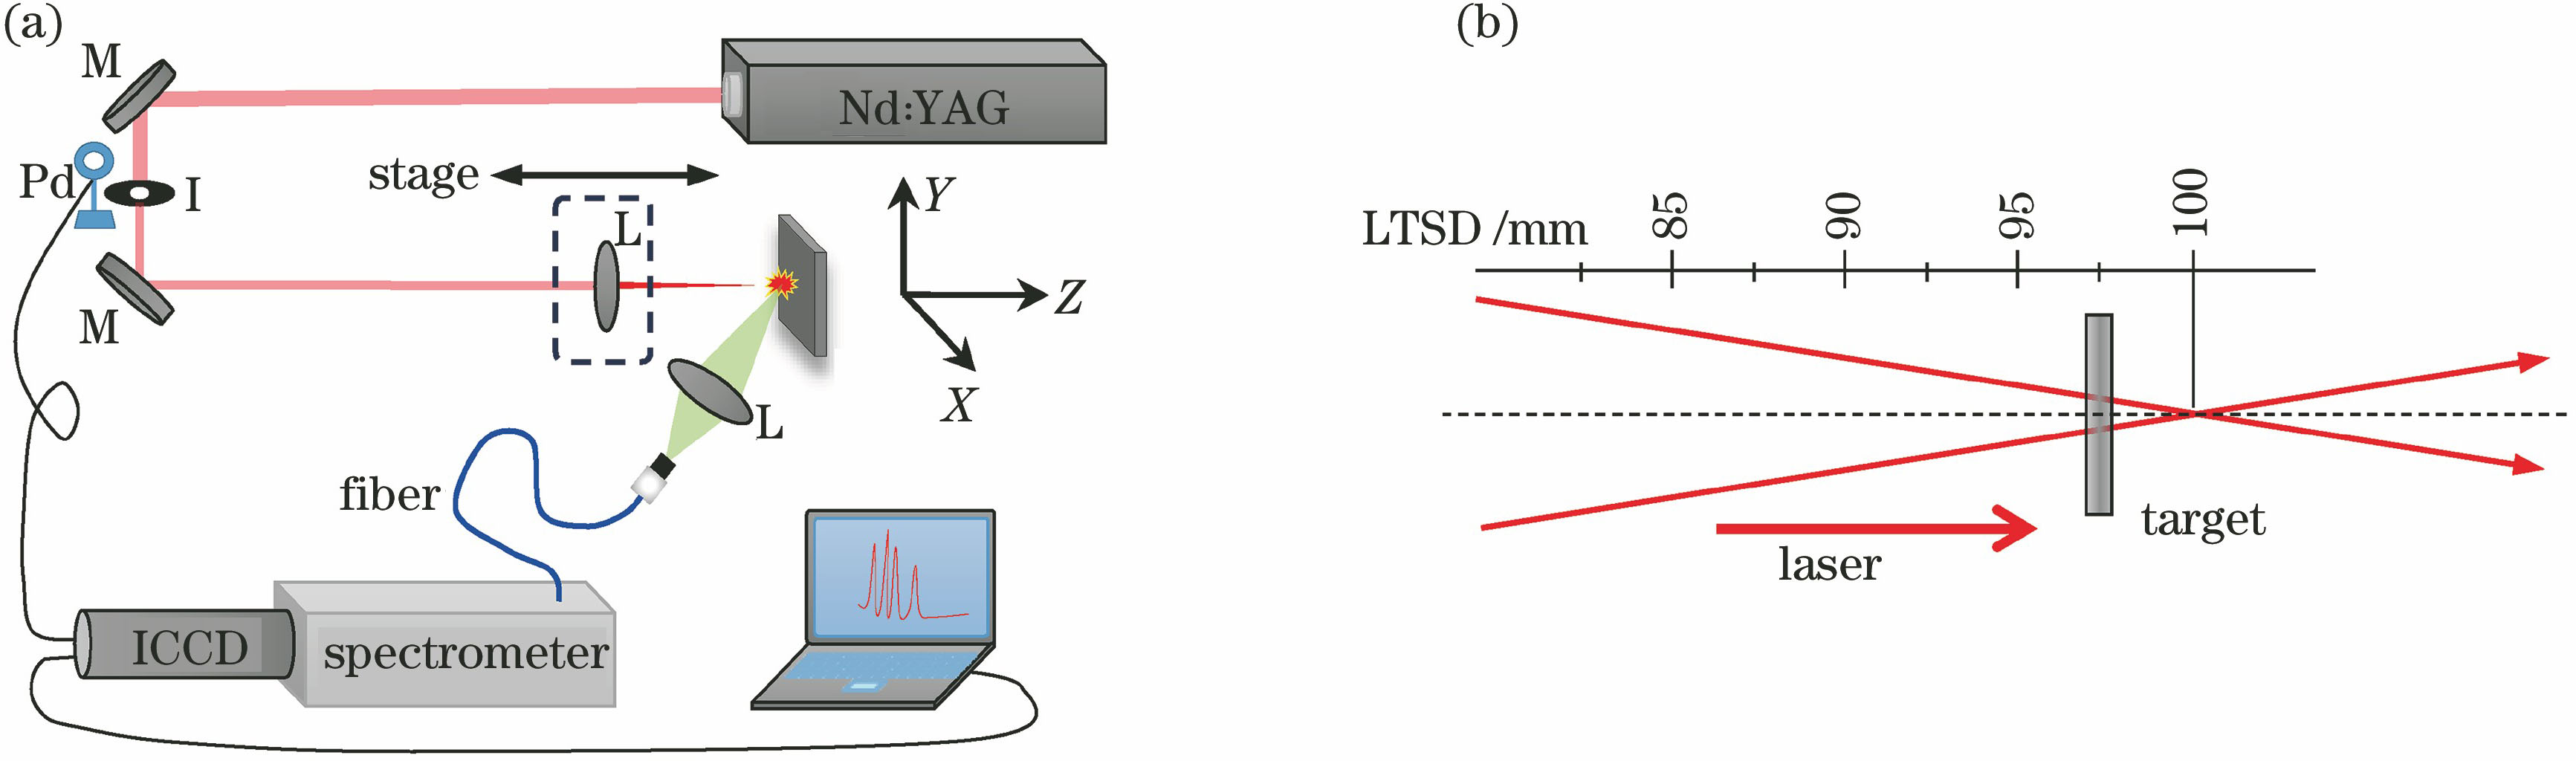
    Fig. 1. Schematics. (a) Experimental setup for analyzing influence of LTSD on spectral intensity in LIBS;(b) relationship between sample location and LTSD
    Typical emission spectra of laser-induced silicon plasmas for three distances when laser energy is 30 mJ. (a) 85.5 mm; (b) 93.5 mm; (c) 96.0 mm
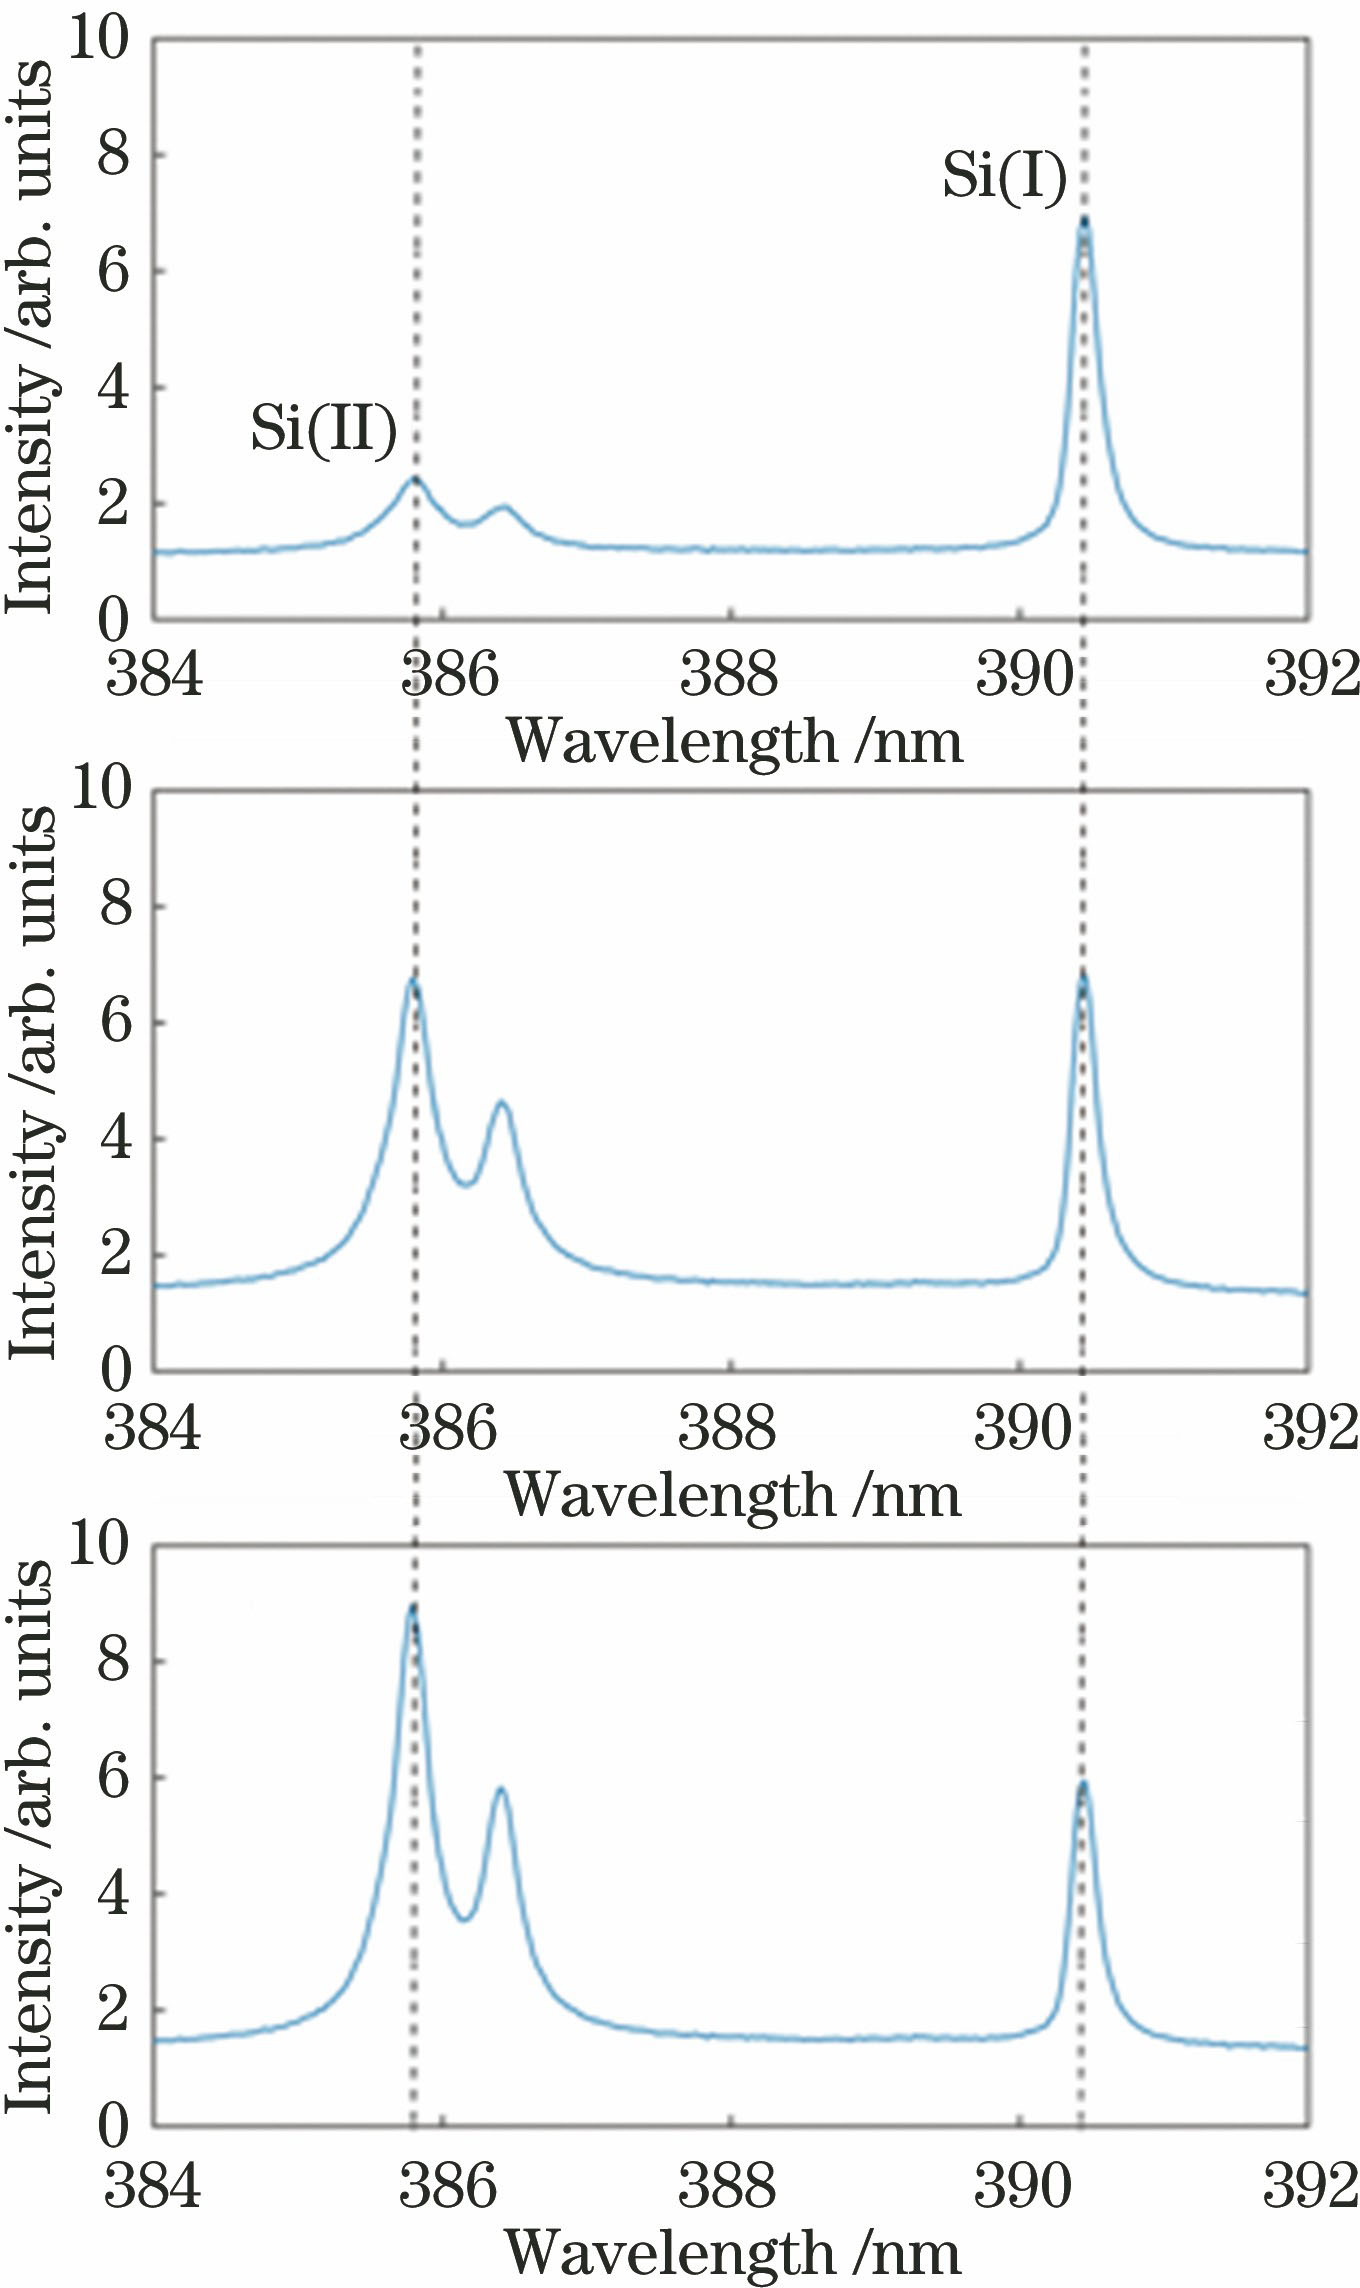
    Fig. 2. Typical emission spectra of laser-induced silicon plasmas for three distances when laser energy is 30 mJ. (a) 85.5 mm; (b) 93.5 mm; (c) 96.0 mm
    Peak intensities of Si(I) 390.55 nm line and Si(II) 385.60 nm line vary with the LTSD when laser energy is 30 mJ
    Fig. 3. Peak intensities of Si(I) 390.55 nm line and Si(II) 385.60 nm line vary with the LTSD when laser energy is 30 mJ
    Peak intensities of line versus LTSD for different laser energies. (a) Si(I) 390.55 nm line; (b) Si(II) 385.60 nm
    Fig. 4. Peak intensities of line versus LTSD for different laser energies. (a) Si(I) 390.55 nm line; (b) Si(II) 385.60 nm
    Ratio of Si(II) line and Si(I) line peak intensities as function of LTSD for different laser energies
    Fig. 5. Ratio of Si(II) line and Si(I) line peak intensities as function of LTSD for different laser energies
    Xue Yang, Dan Zhang, Anmin Chen, Suyu Li, Yuanfei Jiang, Mingxing Jin. Influence of Distance Between Focusing Lens and Sample Surface on Atomic Line and Ionic Line Intensities of Laser-Induced Silicon Plasmas[J]. Chinese Journal of Lasers, 2019, 46(11): 1111001
    Download Citation