• Chinese Journal of Lasers
  • Vol. 46, Issue 2, 0211003 (2019)
Ningxi Meng*, Wei Guo, Lizhi Wu, Ruiqi Shen, Yinghua Ye, and Wei Zhang
Author Affiliations
  • School of Chemical Engineering, Nanjing University of Science and Technology, Nanjing, Jiangsu 210094, China
  • show less
    DOI: 10.3788/CJL201946.0211003 Cite this Article Set citation alerts
    Ningxi Meng, Wei Guo, Lizhi Wu, Ruiqi Shen, Yinghua Ye, Wei Zhang. Characteristics of Laser-Induced Plasma in Porous Anodic Aluminum Oxide[J]. Chinese Journal of Lasers, 2019, 46(2): 0211003 Copy Citation Text show less
    Structure schematics of AAO. (a) Three-dimensional structure; (b) top view; (c) cross-sectional view
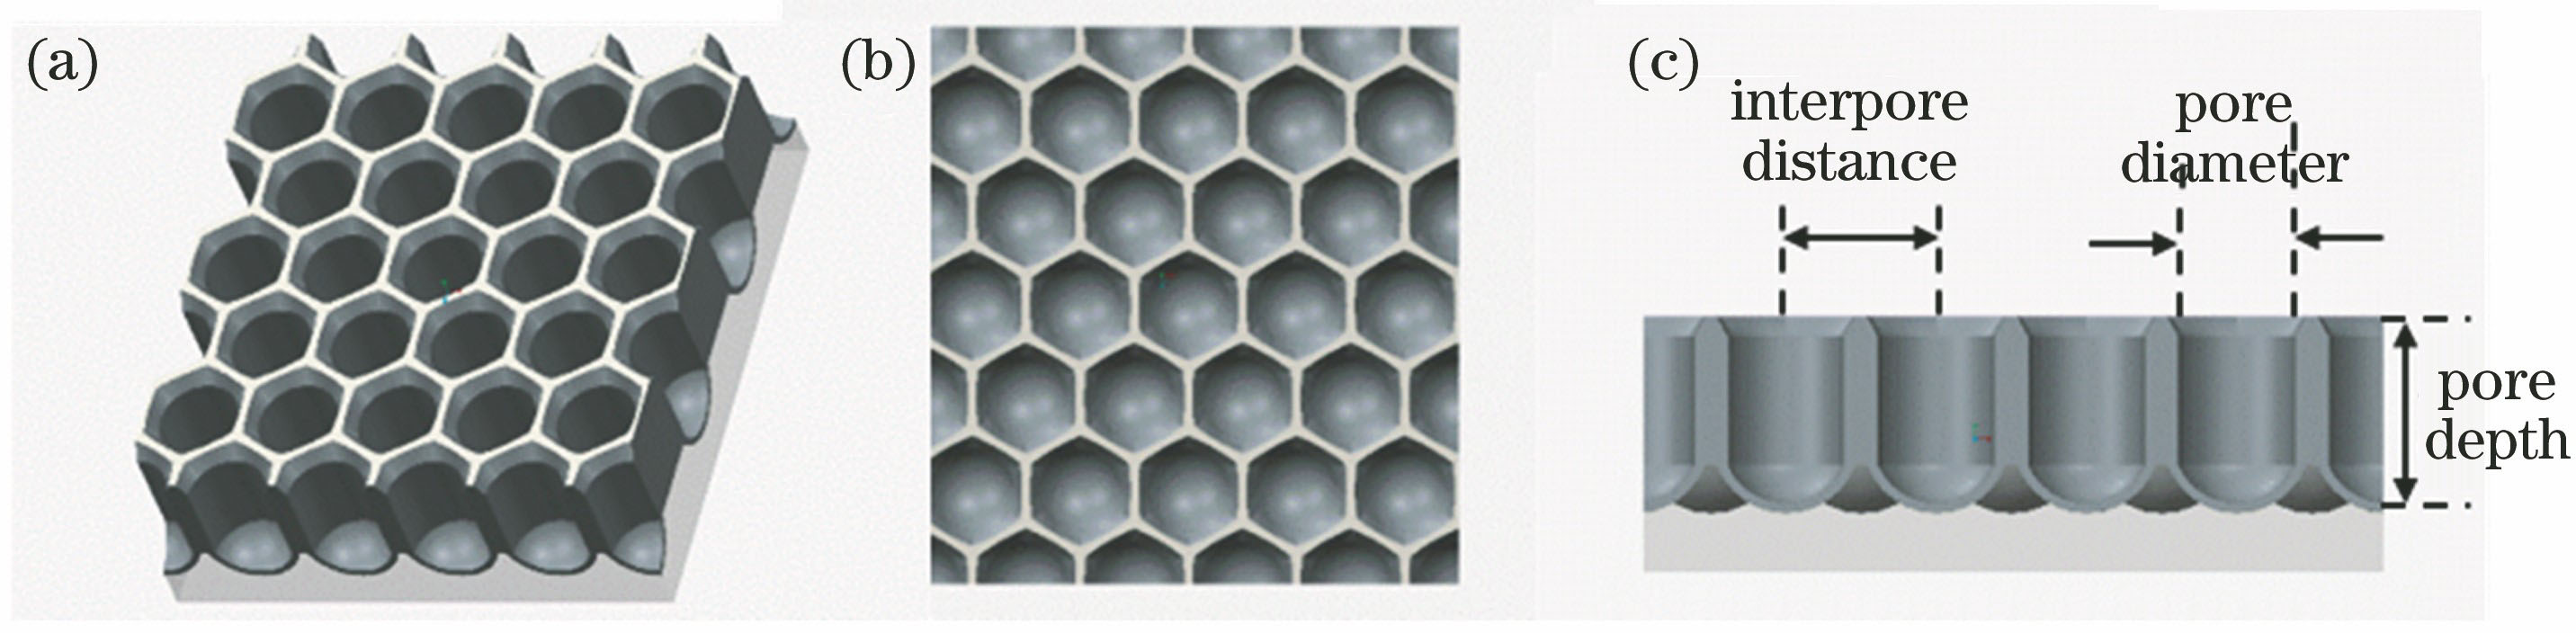
    Fig. 1. Structure schematics of AAO. (a) Three-dimensional structure; (b) top view; (c) cross-sectional view
    Plasma morphology evolution and electronic temperature test system
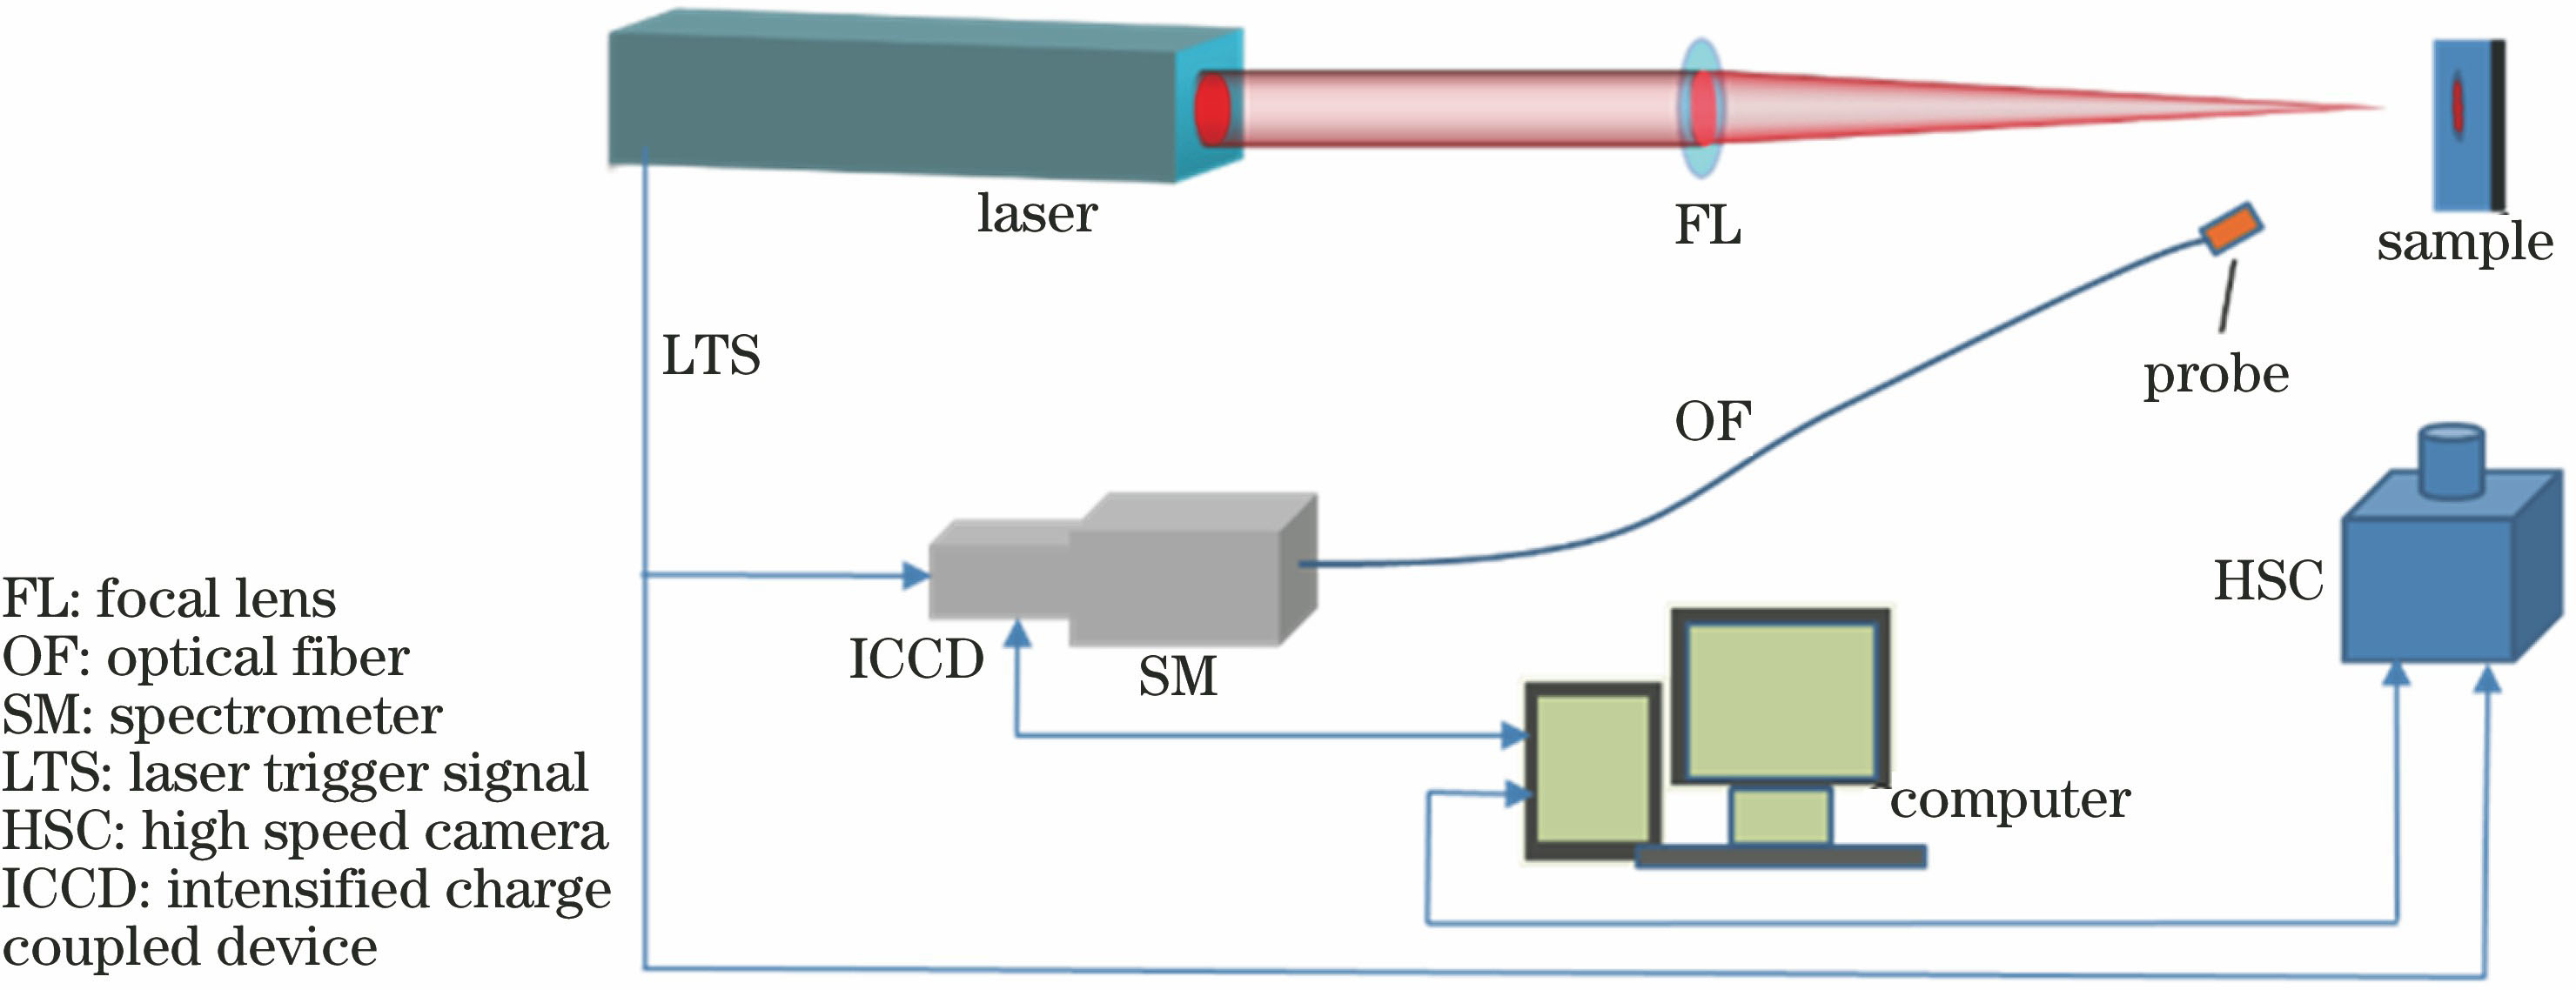
    Fig. 2. Plasma morphology evolution and electronic temperature test system
    Schematic of experimental setup for reflectivity test
    Fig. 3. Schematic of experimental setup for reflectivity test
    SEM images of sample surface and cross-section. (a) Cross-section of SP450-200-550; (b) cross-section of SP450-300-550; (c) cross-section of SP450-400-550; (d) surface of SP450-200-550; (e) surface of SP450-300-550; (f) surface of SP450-400-550; (g) polished aluminum sheet
    Fig. 4. SEM images of sample surface and cross-section. (a) Cross-section of SP450-200-550; (b) cross-section of SP450-300-550; (c) cross-section of SP450-400-550; (d) surface of SP450-200-550; (e) surface of SP450-300-550; (f) surface of SP450-400-550; (g) polished aluminum sheet
    High speed camera images of laser-induced plasma plume. (a) SP450-200-550; (b) SP450-300-550; (c) SP450-400-550; (d) polished aluminum sheet
    Fig. 5. High speed camera images of laser-induced plasma plume. (a) SP450-200-550; (b) SP450-300-550; (c) SP450-400-550; (d) polished aluminum sheet
    Emission spectra and line intensity as a function of delay time. (a) Emission spectra; (b) line intensity
    Fig. 6. Emission spectra and line intensity as a function of delay time. (a) Emission spectra; (b) line intensity
    Variation of plasma electron temperature as a function of delay time
    Fig. 7. Variation of plasma electron temperature as a function of delay time
    Measured and simulated reflectivity of AAO with periodic structure. (a) Schematics of FDTD simulation; (b) measured reflectivity; (c) simulated reflectivity; (d) electric field intensity monitoring maps of y-z cross-section
    Fig. 8. Measured and simulated reflectivity of AAO with periodic structure. (a) Schematics of FDTD simulation; (b) measured reflectivity; (c) simulated reflectivity; (d) electric field intensity monitoring maps of y-z cross-section
    Emission lineWavelength /nmUpper level energy /cm-1Excitation energy /eVgA /(108 s-1)
    Al Ⅰ308.21632435.4534.022.52
    Al Ⅰ309.27132436.7964.024.44
    Al Ⅰ394.40125347.7563.140.986
    Al Ⅰ396.15225347.7563.141.96
    Table 1. Corresponding transitions of Al emission lines and their physical parameters
    Ningxi Meng, Wei Guo, Lizhi Wu, Ruiqi Shen, Yinghua Ye, Wei Zhang. Characteristics of Laser-Induced Plasma in Porous Anodic Aluminum Oxide[J]. Chinese Journal of Lasers, 2019, 46(2): 0211003
    Download Citation