
Zixiao Miao, Qican Zhang, "Dual-frequency fringe for improving measurement accuracy of three-dimensional shape measurement," Chin. Opt. Lett. 19, 102601 (2021)
- Chinese Optics Letters
- Vol. 19, Issue 10, 102601 (2021)
Abstract
1. Introduction
Three-dimensional (3D) shape reconstruction has been widely used in the practical applications of modern information technology in machine design, industrial inspection, robotics, and game industry due to its high speed and high flexibility[
The phase unwrapping algorithms can be commonly classified into spatial phase unwrapping[
Among temporal phase unwrapping algorithms, one popular method is to use the dual-frequency (or wavelength) phase-shifting technique[
Sign up for Chinese Optics Letters TOC. Get the latest issue of Chinese Optics Letters delivered right to you!Sign up now
The phase sum with high sensitivity in two-wavelength phase-metrology (TWPM) was proposed for the first time, to the best of our knowledge, by Mustafin and Seleznev in 1970[
2. Principle
In 3D shape measurement using fringe structured light, the intensity of deformed fringes recorded by a digital camera can be given by
Since there are three unknowns,
The phase value provided from Eq. (2) contains
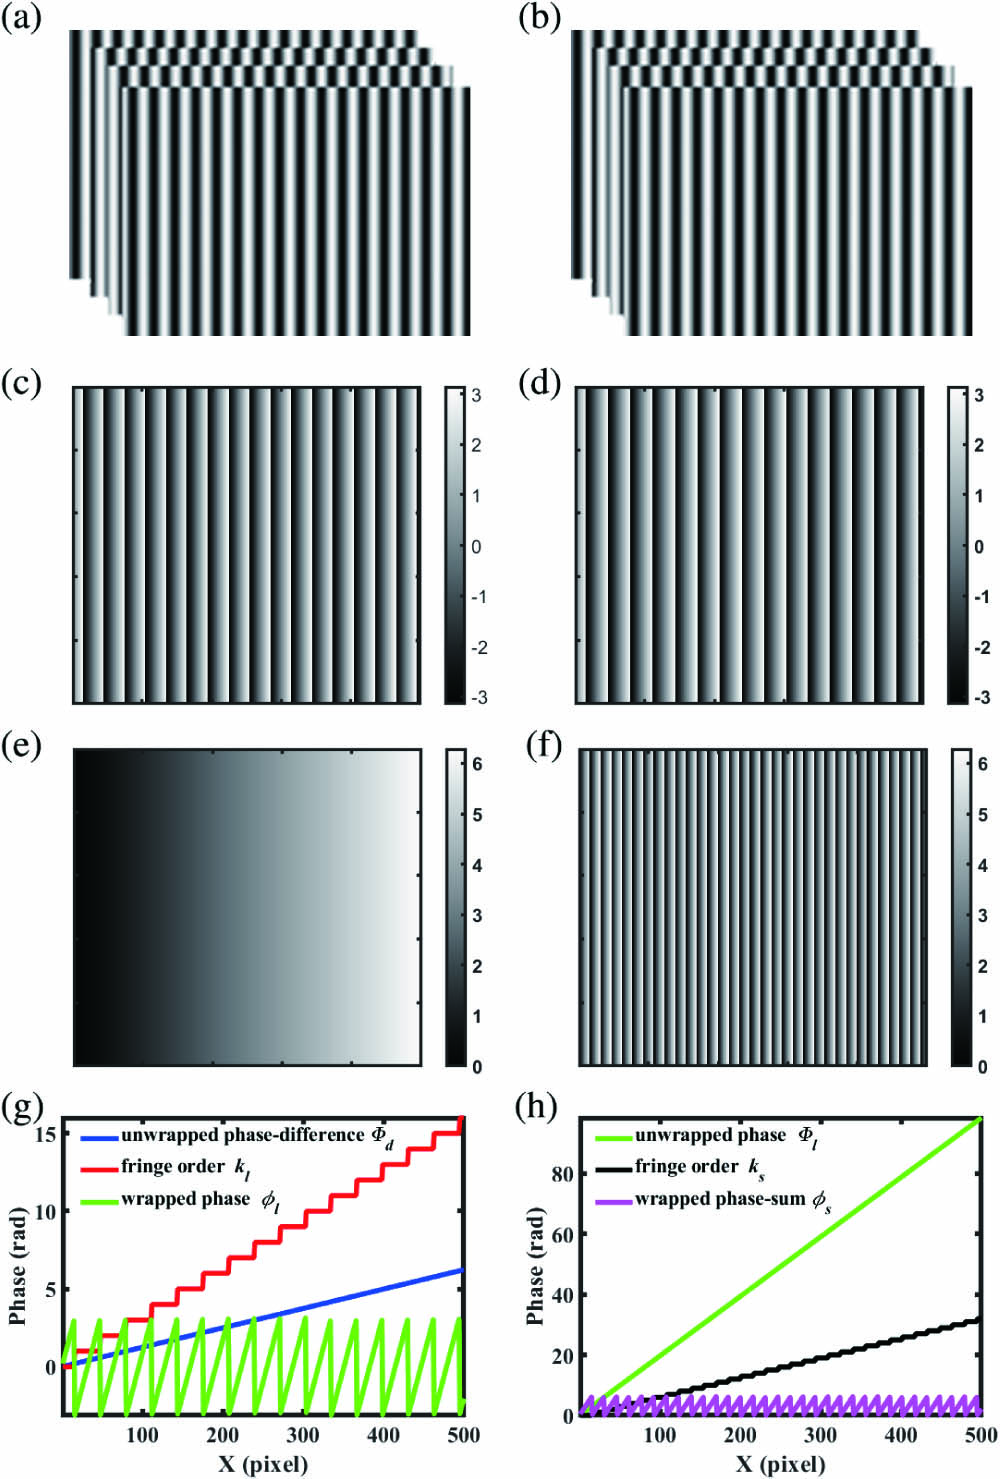
As shown in Fig. 1, in 3D shape measurement based on dual-frequency fringes, two projected fringes with different frequencies,
![]()
Figure 1.Principle of the proposed dual-frequency method: (a) four phase-shifting patterns of fh; (b) four phase-shifting patterns of fl; (c) wrapped phase ϕh; (d) wrapped phase ϕl; (e) phase difference ϕd; (f) phase sum ϕs; (g) one cross section of the unwrapped phase difference Φd, fringe order kl, and wrapped phase ϕl; (h) one cross section of the phase sum ϕs, fringe order ks, and unwrapped phase Φl.
If the phase-difference map ranging from 0 to
The fringe order
This results in the unwrapped phase of
The fringe order
This results in the unwrapped phase of
The measured object’s absolute phase map can be obtained by subtracting the phase of the reference plane from the unwrapped phase in the phase-sum information.
The synthetic frequency information and their phases depend on the frequencies of the projected fringes. By selecting the appropriate fringe’s frequency, the synthetic frequency will change accordingly. The phase difference extends the range of measurable depth variation by the synthetic lower frequency. In addition, the synthetic phase sum has an averaging effect in the process of calculating the synthetic frequency and thus smoothing the phase noise.
In order to illustrate the relationship of phase difference with phase sum, the sensitivity gain
That is, the phase sum is
However, the synthesis fringes corresponding to the phase difference should cover the whole measurement area, which means that the two projected frequencies are close to each other, and
3. Computer Simulation
We simulated 3D shape measurement by using FPP for a tested object whose shape distribution acts like the peaks function. The diagram of the computer simulation process of this work is shown in Fig. 2. The process of phase unwrapping uses the phase difference
![]()
Figure 2.Chart of the computer simulation process of the proposed dual-frequency by FPP.
The continuous phase is
![]()
Figure 3.Computer simulation results of the proposed dual-frequency in 3D shape measurement. (a), (b) One cross section of wrapped phases (Tl = 170 pixels, Th = 150 pixels) and synthetic phases (Td = 1275 pixels, Ts = 79.7 pixels); (c) one cross section of wrapped phase ϕl, phase difference ϕd, and fringe order kl; (d) one cross section of wrapped phase ϕs, unwrapped phase Φl, and fringe order ks; (e) one cross section of the restored object’s height; (f) one cross section of the restored height error.
In order to compare the performance of the proposed method, a random Gaussian noise with a signal-to-noise ratio (SNR) of 27 dB is designed to be added in the simulated fringes, and all of the phase distributions have been transformed to the height distribution. Figure 3(e) shows the cross section along one row of the restored object’s height. Related to the simulated object’s truth shape, the corresponding height errors restored by two original projected fringes and the synthetic fringes were analyzed, and their cross sections along one row are shown in Fig. 3(f). Due to the higher synthetic frequency and denser wrapped phase fringes, we can see that the noise of the synthetic frequency’s restored height (magenta line) is obviously smaller than that of the other two. The standard deviation (STD) of the synthetic frequency’s height error distribution is 0.325, while those of
In this simulation, the phase sensitivity gain
To confirm the relationship between the sensitivity gain
![]()
Figure 4.Trend chart of measurement accuracy with the high frequency of 1/30 and changing low frequency.
It is clear that the accuracy is the best when the dual-frequency fringes are close to each other. We conclude that the effect of phase sum for improving accuracy relies on the ratio of
4. Experimental Results
To further verify the performance of the proposed method, we developed an FFP system including a projection system [digital projector with a digital light processing (DLP) chip and the resolution of
In our experiments, the absolute phase calculated by a 24-step phase-shifting algorithm is used as the ground truth. It should be noted that all of the images have been cropped according to the tested object in the following illustrations. In these experiments, we compared the 3D reconstruction accuracy of the proposed method with that of the conventional dual-frequency method reported in literature [24]. In order to verify the proposed method, the reference plane was first measured, and the reconstruction phase error is shown in Fig. 5. The measurement accuracy of the conventional dual-frequency method is mainly determined by the high frequency of two projected fringes, so it will not be improved even though the low-frequency fringe is changing. The STD of the conventional dual-frequency method is 0.0165, while the STD of the proposed dual-frequency method is, respectively, 0.0130, 0.0143, 0.0154, 0.0164, and 0.0170 with the increasing
![]()
Figure 5.Reconstruction phase error of reference plane (a) by the conventional dual-frequency method and (b)–(f) by the proposed dual-frequency method with different low frequencies (fh = 1/45, and fl = 1/50, 1/70, 1/90, 1/120, 1/140).
Then, one simple object with a smooth surface and one complex object were measured. The unwrapped phase was obtained to reconstruct the 3D shape of the measured object. Figures 6(a) and 6(b) show one of the captured fringe patterns with very close spatial frequencies having
![]()
Figure 6.Experimental results of measuring a simple object: (a), (b) one of the captured fringe patterns of fh and fl (Th = 80 pixels, Tl = 85 pixels); (c), (d) wrapped phases ϕh and ϕl; (e) phase difference (Td = 1360 pixels); (f) wrapped phase sum (Ts = 41.2 pixels); (g) fringe order kl; (h) unwrapped phase Φl; (i) fringe order ks; (j) unwrapped phase sum Φs.
In order to research the relationship between the sensitivity gain
![]()
Figure 7.Reconstruction of the object’s absolute phase (a) by the conventional dual-frequency method and (b)–(f) by the proposed dual-frequency method with different low frequencies (fh = 1/45, and fl = 1/50, 1/70, 1/90, 1/120, 1/140).
![]()
Figure 8.Reconstruction phase errors with different low frequencies corresponding to Fig.
Figure 9 is a trend chart of measurement accuracy of actual experiments with a fixed high frequency and a varied low frequency. The measured object in Fig. 9(a) is the foam heart in the first experiment scene, and the measured object in Fig. 9(b) is the petal in the second experiment scene. It is obvious that the phase error becomes larger as the frequency difference between the two original fringes increases. It can also be concluded that the higher the sensitivity gain
![]()
Figure 9.Trend chart of measurement accuracy of actual experiments with a fixed high frequency and various low frequencies in measuring (a) the foam heart and (b) the petal.
5. Conclusion
In this study, a dual-frequency method in 3D measurement is certified to enhance the measurement accuracy. Compared with the conventional dual-frequency method, the proposed dual-frequency method employs the phase sum of two different frequency projected fringes to improve the measuring accuracy. A synthetic fringe is acquired, which is higher in frequency than either of the original projected fringes. The measurement results with the synthetic fringes are superior to that of a single frequency fringe, and higher measurement accuracy is also obtained. In addition, the relationship between the sensitivity gain
References
[1] F. Chen, G. Brown, M. Song. Overview of 3-D shape measurement using optical methods. Opt. Eng., 39, 10(2000).
[2] X. Su, Q. Zhang. Dynamic 3-D shape measurement method: a review. Opt. Lasers Eng., 48, 191(2010).
[3] S. Zhang. High-speed 3D shape measurement with structured light methods: a review. Opt. Lasers Eng., 106, 119(2018).
[4] C. Zuo, S. Feng, L. Huang, T. Tao, W. Yin, Q. Chen. Phase shifting algorithms for fringe projection profilometry: a review. Opt. Lasers Eng., 109, 23(2018).
[5] L. Li, Z. Pan, H. Cui, J. Liu, S. Yang, L. Liu, Y. Tian, W. Wang. Adaptive window iteration algorithm for enhancing 3D shape recovery from image focus. Chin. Opt. Lett., 17, 061001(2019).
[6] J. Dai, L. Huang, K. Guo, L. Ling, H. Huang. Reflectance transformation imaging of 3D detection for subtle traces. Chin. Opt. Lett., 19, 013501(2021).
[7] S. Zhang. High-resolution 3D profilometry with binary phase-shifting methods. Appl. Opt., 50, 1753(2011).
[8] S. Zhang, D. Weide, J. Oliver. Superfast phase-shifting method for 3-D shape measurement. Opt. Express, 18, 9684(2010).
[9] C. Zuo, Q. Chen, S. Feng, G. Gu, A. Asundi. Real-time three-dimensional infrared imaging using fringe projection profilometry. Chin. Opt. Lett., S21101(2013).
[10] V. Srinivasan, H. Liu, M. Halioua. Automated phase-measuring profilometry of 3-D diffuse objects. Appl. Opt., 23, 3105(1984).
[11] X. Su, G. Bally, D. Vukicevic. Phase-stepping grating profilometry: utilization of intensity modulation analysis in complex objects evaluation. Opt. Commun., 98, 141(1993).
[12] S. Zhang, S. T. Yau. High-resolution, real-time 3D absolute coordinate measurement based on a phase-shifting method. Opt. Express, 14, 2644(2006).
[13] M. Takeda, H. Ina, S. Kobayashi. Fourier-transform method of fringe-pattern analysis for computer-based topography and interferometry. J. Opt. Soc. Am. A, 72, 156(1982).
[14] X. Su, W. Chen. Fourier transform profilometry: a review. Opt. Lasers Eng., 35, 263(2001).
[15] R. Goldstein, H. Zebker, C. Werner. Satellite radar interferometry: two-dimensional phase unwrapping. Rad. Sci., 23, 713(1988).
[16] T. Flynn. Two-dimensional phase unwrapping with minimum weighted discontinuity. J. Opt. Soc. Am. A, 14, 2692(1997).
[17] X. Su, W. Chen. Reliability-guided phase unwrapping algorithm: a review. Opt. Lasers Eng., 42, 245(2004).
[18] J. Huntley, H. Saldner. Temporal phase-unwrapping algorithm for automated interferogram analysis. Appl. Opt., 32, 3047(1993).
[19] Y. Cheng, J. Wyant. Two-wavelength phase shifting interferometry. Appl. Opt., 23, 4539(1985).
[20] V. Gushov, Y. Solodkin. Automatic processing of fringe patterns in integer interferometers. Opt. Lasers Eng., 14, 311(1991).
[21] C. Zuo, L. Huang, M. Zhang, Q. Chen, A. Asundi. Temporal phase unwrapping algorithms for fringe projection profilometry: a comparative review. Opt. Lasers Eng., 85, 84(2016).
[22] K. Creath. Step height measurement using two-wavelength phase-shifting interferometry. Appl. Opt., 26, 2810(1987).
[23] D. Towers, J. Jones, C. Towers. Optimum frequency selection in multifrequency interferometry. Opt. Lett., 28, 887(2003).
[24] J. Hyun, S. Zhang. Enhanced two-frequency phase-shifting method. Appl. Opt., 55, 4395(2016).
[25] K. S. Mustafin, V. A. Seleznev. Methods of increasing the sensitivity of holographic interferometry. Sov. Phys. Uspekhi, 13, 416(1970).
[26] J. Di, W. Qu, B. Wu, X. Chen, J. Zhao, A. Asundi. Dual wavelength digital holography for improving the measurement accuracy. Proc. SPIE, 8769, 87690G(2013).
[27] J. Di, J. Zhang, T. Xi, C. Ma, J. Zhao. Improvement of measurement accuracy in digital holographic microscopy by using dual-wavelength technique. J Micro/Nanolithogr. MEMS, MOEMS, 14, 041313(2015).


Set citation alerts for the article
Please enter your email address

© Copyright 2018-2021 | Chinese Laser Press. All Rights Reserved 沪ICP备15018463号-20