
Xintong Xu, Shuangchen Ruan, Jianpang Zhai, Ling Li, Jihong Pei, Zikang Tang. Facile active control of a pulsed erbium-doped fiber laser using modulation depth tunable carbon nanotubes[J]. Photonics Research, 2018, 6(11): 996
- Photonics Research
- Vol. 6, Issue 11, 996 (2018)
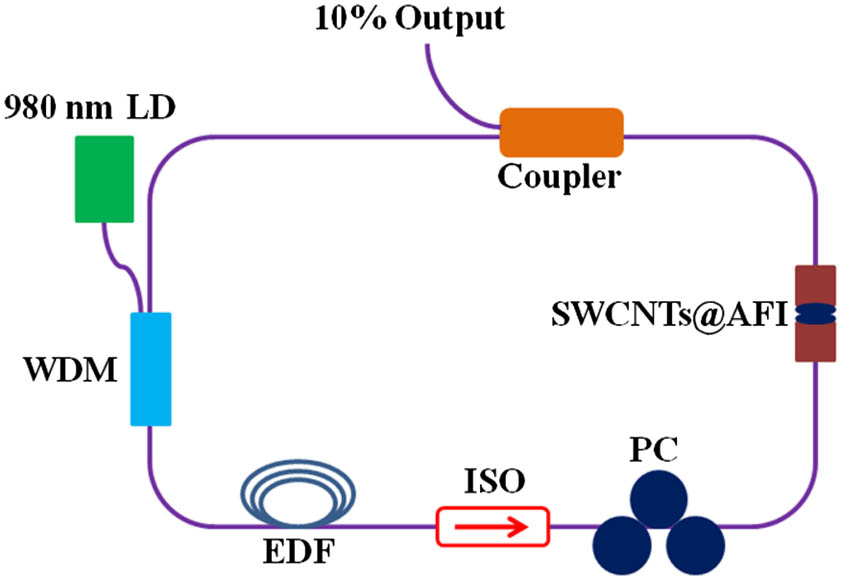
Fig. 1. Schematic diagram of the erbium-doped fiber laser.
![(a) Scanning electron microscopy image of pristine AFI single crystals. (b) Framework structure of an AFI single crystal viewed along the [001] direction. (c) SWCNTs are sketched inside the channels of AFI. (d) Raman spectrum of the SWCNTs@AFI single crystal.](/richHtml/prj/2018/6/11/11000996/img_002.jpg)
Fig. 2. (a) Scanning electron microscopy image of pristine AFI single crystals. (b) Framework structure of an AFI single crystal viewed along the [001] direction. (c) SWCNTs are sketched inside the channels of AFI. (d) Raman spectrum of the SWCNTs@AFI single crystal.
Fig. 3. (a) Experimental setup for the measurement of saturable absorption of SWCNTs@AFI. Dots are the measured data and the red line is the data fitting. Pulse excitation wavelength at 1.5 μm with different polarization directions (b) E ∥ C E ⊥ C
Fig. 4. Typical oscilloscope traces of the Q
Fig. 5. Pulse duration and average output power as functions of polarization angle.
Fig. 6. Output characteristic of the EDFL operated in the Q
Fig. 7. Saturable absorption properties of the SWCNTs@AFI SA under different polarization angles of (a) 20°, (b) 40°, and (c) 70°.
Fig. 8. Output characteristic of the EDFL operated in the mode-locking state. (a) Pulse train. (b) Emission spectrum. (c) Single pulse profile. (d) Radiofrequency spectrum.
Fig. 9. Optical spectrum and corresponding single pulse profile of mode-locking under different polarization angles of (a) 46°, (b) 52°, (c) 60°, and (d) 70°.
Fig. 10. (a) Emission spectrum, (b) autocorrelation trace, (c) pulse train, and (d) radiofrequency spectrum of two bound soliton EDFL.
Fig. 11. (a) CW laser output spectrum of the EDFL without a carbon nanotube SA in the cavity. (b) Laser intensity as a function of time.

Set citation alerts for the article
Please enter your email address
© Copyright 2018-2021 | Chinese Laser Press. All Rights Reserved 沪ICP备15018463号-20