
Ying Zhao, Yanhua Lu, Yaoyao Du, Jun He, Taoguang Xu, Di Yin, Huizhou Ma, Junhui Yue, Yanfeng Sui, Xiaohua Peng. A bunch charge measurement system based on Turbo-ICT for BEPCII[J]. High Power Laser and Particle Beams, 2021, 33(11): 114002
- High Power Laser and Particle Beams
- Vol. 33, Issue 11, 114002 (2021)
Abstract
The BEPCII (Upgrade project of Beijing Electron Positron Collider) injector consists of a linear accelerator (linac) and e− and e+ transportation lines. There are 5 Beam Current Monitors (BCTs) installed along the linac, 7 BCTs on each transportation line, which are used for bunch current measurement. These sensors were designed for the early BEPCII, where the rising time was about 300 ps, which was sufficient for 1ns bunch length at that time[
1 Parameters and installation of the system
The system will be used to monitor bunch charge and calculate injection efficiency in both collide and synchrotron mode. The present main parameters of BEPCII LINAC are listed in Table 1[
| repetition rate/Hz | frequency/MHz | bunch length/ps(2σ) | energy/GeV |
| *It is adjustable, depending on the need of injection. | |||
| 50* | 2856 | 10 | 1.89−2.5 |
Table 1. Main parameters of BEPCII LINAC
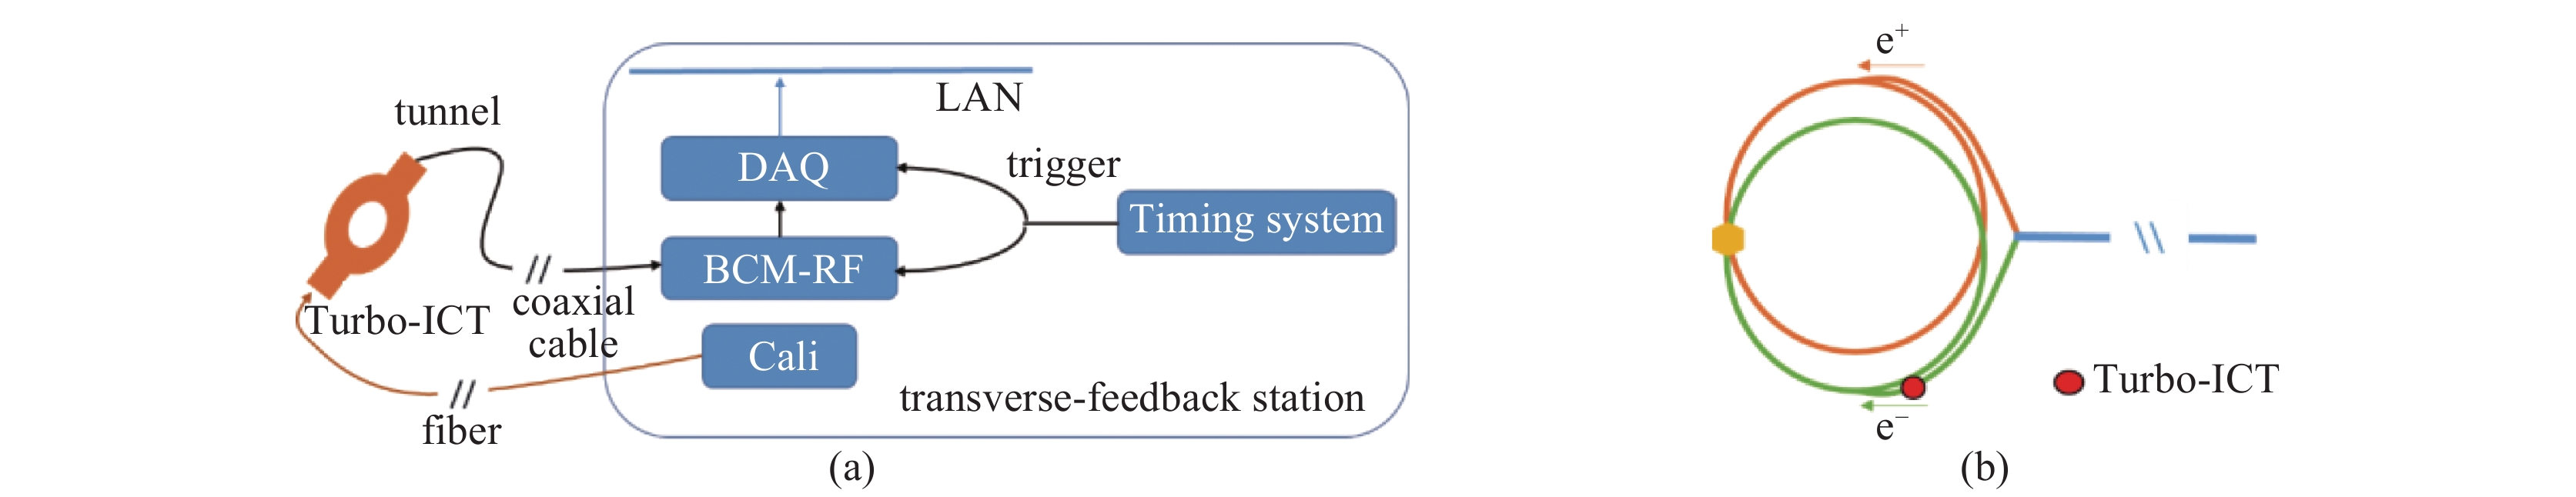
The charge measurement system includes an Turbo-ICT (Turbo Integrating Current Transformer) sensor, BCM-RF (Beam Charge Monitor-Radio Frequency) electronics, DAQ (Data Acquisition) electronics and an online calibration set. The Turbo-ICT sensor is installed at the end of the e− transportation line (Fig.1(b)), after dipole TE-B16 along the beam transport direction, about 20 m from the e− injection point. The main parameters are listed in Table.2. In consideration of proper distance for signal transmission, BCM-RF, DAQ and the online calibration set are located in the transverse feedback station. The schematic of the system and the sensor’s simple layout is shown in Fig.1(a).
![]()
Figure 1.Schematic of the system (a) and location of Turbo-ICT (b)
| Turbo-ICT flange | Turbo-ICT length/mm | BCM-RF scale/nC | BCM-RF output/V |
| DN100 | 40 | 0.05−2 | +5 |
Table 2. Parameters of charge measurement system
2 Measurement principle and function introduction
Turbo-ICT is a commercial current transformer from Bergoz Instrumentation[
Typical ICT is used for short bunch current measurement. It contains two magnetic cores. A capacitor is put on the sensor’s out shell as the first winding, when beam bunch is passing through, the capacitor is charged. A second winding is wounded on only one core with a resistor for readout. When the charged capacitor releases in a slow rate, a signal excited on the second winding will change the resistor’s potential. The voltage of the resister is proportional to the charge. The sensor can be seen as a low pass filter for pulse bunch magnetic fields, but the charge value is maintained. The schematic of ICT is shown in Fig.2[
![]()
Figure 2.Schematic of ICT
The ICT’s two-stage windings move the bunch signal to a lower frequency domain close to DC and the charge information is completely saved. In this process, the longitudinal information of the bunch is sacrificed, and the length of the bunch won’t influence the measurement, too.
Furthermore, ultra-short single beam bunch down to picosecond can be seen as a Dirac signal[
Based on the principle, an FEFA (Front-End Amplifier and Filter) module is applied to the ICT. The module has a band-pass filter to narrow the output signal at around 180 MHz[
![]()
Figure 3.Turbo-ICT on BEPCII
Fig.4(a) indicates all signals from BCM-RF respectively: logarithmic signal (yellow), hold signal (red), sample and peak holding output signal (blue), the trigger signal (green) from BEPCII timing system which is synchronized with electron gun. By adjusting the delay of the trigger signal (green), the logarithmic signals’ peak is set at the rising edge of the hold signal.
![]()
Figure 4.BCM-RF output signal view and BCM-RF GUI
A vender-manufactured Labview based GUI (Graphical User Interface) is provided for BCM-RF parameters setting as shown in Fig.4(b). The electronics need enough time to hold single bunch peak value and the hold value is a DC voltage up to 100 ms, the interval of bunches should be longer than 500 ns.
The BCM-RF calibration function is used cooperatively with a CAL-FO module, which is a separate photon-electric conversion module fixed on the Turbo-ICT sensor, as can be seen in Fig.3. A calibrated pulse generator sends out an optical signal manually to the module through an optic fiber, simulating a short beam pulse into the sensor, and the BCM-RF output can be read from the GUI. The waveform in Fig.4. (b) indicates a typical online calibration result, each pulse is one output of the simulated bunch from calibrated-pulse-generator. The calibration result is UBCM-RF = 2.778 V, which matches the factory setting of the calibrated pulse generator: QCAL-FO = (150.5±2.0) pC.
3 Data acquisition and processing
3.1 Data acquisition hardware
RedPitayaSTEMlab 125-14 board from Sloveniais is used for collecting data from BCM-RF. It’s a commercial FPGA Xilinx Zynq 7010 based board with various interfaces, whose main features are listed in Table.3[
| RF Input full scale voltage/V | RF Input channels | Sample rate/(MS/s) | ADC resolution/bit | Bandwidth |
| ±20 | 2 | 125 | 14 | DC−60 MHz |
Table 3. Main features of RedpiataySTEMlab 125-14
This kind of board can operate on an OS (Operating System) of Ubuntu 16.04.3. A 16 Gbyte SD card is adopted to complete booting and initialization. A pre-built image can be downloaded from RedPitaya official webserver[
A crate is designed locally for well shielding and long-term stability. Mingwei AC-DC power supply module is used instead of its original one for reducing the ripple noise.
The BEPCII control system uses EPICS database, which is a set of open source software tools, libraries and applications developed collaboratively[
![]()
Figure 5.Schematic of DAQ
3.2 Conversion coefficient calibration and data processing
The task of conversion from voltage to charge is accomplished in db (data base) file. The voltage signal from BCM-RF is assigned to a PV, then CALC field is used to complete the voltage-charge transformation.
The real cable’s attenuation between Turbo-ICT sensor and BCM-RF-E would affects the conversion coefficient, thus it should be considered. In this case, a 50 m LMR-200 coaxial-cable has 7.2 dB attenuation at 180 MHz, the cable test result by network analyzer is shown in Fig.6.
![]()
Figure 6.Attenuation of the LMR-200 cable
The sensitivity of the system can be calculated as
where Qcal and Ucal are calibration constants, they are factory measured and set in the BCM-RF. K is the transmission coefficient of FEFA and it is a fixed value. The parameter D is the drop at 180 MHz in the cable, it can be calculated as Ux/UTurbo-ICT,Ux is the input at the BCM-RF and UTurbo-ICT is the output at the sensor. Hence, for a new cable, the attenuation can be considered as
assuming U1 is the input of BCM-RF and UTurbo-ICT is Turbo-ICT output. S1 =0.06228 is the original coefficient which is provided in the factory calibration report, and the cable’s attenuation used for calibration is 4.2 dB. U2 and S2 are the BCM-RF input and coefficient at attenuation of 7.2 dB.
The final relation expression is
It is noticed that there is a wiggle on the output signal (blue) due to the sample-and-hold circuit as shown in Fig.4(a), effective data acquisition should start after this 200 ns wiggle. For BCM-RF, one bunch’s output voltage would maintain still until the next bunch is coming, which will last approximately 200 ms, so the ADC trigger delay could set greater than 200 ns by trigger delay PV, and the data acquired is reliable.
The timing of charge data should be exactly aligned with other parameters of the accelerator, practically the current data in the storage ring (SR). For getting accurate timestamp of data, Network Time Protocol (NTP) client is installed and set to check and correct RP 125-14 system time with BEPCII timing system. A Cron service is used to perform this task hourly.
4 Online measurement results
The charge measurement system has been applied to BEPCII commissioning and it works well. A 10-hours long term data of e−/e+ SR beam current from DCCT and injected e− charge from charge measurement system are shown in Fig.7(a). The accelerator operated on collide mode, and the injection period was about 1 h. The injection would start when the beam current in the SR was down to 600 mA. The charge curve fits well with the e− beam current accumulating curve. During the non-injection period, the data from charge measurement system showed that the noise signal was close to zero. In a single injection as shown in Fig.7 (b), the charge result (upper) is consistent with the transmission efficiency tendency (down). The transmission efficiency is a relative value, provided by the ratio of two BPM sum data. The first BPM is at the start point of transmission line, the second one is near the e− injection point after the Turbo-ICT sensor. According to the curves, low charge is corresponding to low transfer efficiency. But some spots in the transfer efficiency curve do not match with those in the charge curve, because there is mass beam loss after the first BPM.
![]()
Figure 7.10 h current/charge curve (a) and charge/transmission efficiency (b)
4.1 Results in collide mode
During high current collide operation mode, when SR beam current is above 600mA, e− injection frequency is usually set to 50Hz/3 for avoiding over fast filling, which might cause beam instability and loss. Take one shot to evaluate the injection rate: the increment of current per second in the storage ring could transfer to charge value for the SR repetition rate 1.262 MHz, about 792 ns[
![]()
Figure 8.Large current collide mode (a) and synchrotron top-up mode (b) injection measurement results
4.2 Results in synchrotron mode
In the synchrotron top-up mode, the SR repetition rate is 1.242 MHz, about 805 ns. The injection frequency is 12.5 Hz/3 for avoiding over filling the beam bunches. In subfigure 3 of Fig. 8(b) there is a 7 h long current curve, and the top-up scale is from 249 mA to 251 mA. Subfigure 2 in Fig.8(b) shows the charge curve for each injection variant from 30−40 pC, and subfigure 1 in Fig.8(b) gives the injection rate which is mostly around 60%−90%.
5 Conclusion and outlook
Turbo-ICT shows good performance in BEPCII normal operating modes, especially low charge measurement in top-up mode. The charge measurement system has been operating stably since it was put into use.
But more study and intensive work are necessary for BEPCII now and upgrade project. A Faraday cup is planned to be installed at the start point of the transportation line, so that absolute BPM sum value could be calibrated then. This would supplement the quantitative comparison of charge measurement systems. Although the beam loss can be ignored theoretically in the last section of the transportation line, it still needs experiment to verify. An accurate charge measurement for positron injection is also under consideration for a complete thought. The experience could be a guide for similar system, applied to other kind of accelerators, laser-plasma system or FEL.
References
[1] Zhang Chuang, Ma Li. Design development of upgrade project of Beijing electron positron collide accelerat[M]. Shanghai: Shanghai Scientific & Technical Publishers, 2015: 4.
[2] TURBOICT & BCMRFE[EBOL]. https:www.bergoz.comproductsturboict
[3] Belohrad D, Krupa M, Sby L, et al. A new integrating current transfmer f the LHC[C]Proceedings of the 3rd International Beam Instrumentation Conference (IBIC’14). Monterey, CA, USA: SLAC National Accelerat Labaty, 2014.
[4] Stulle F, Bergoz J, Instrumentation B, et al. TURBOICT picocoulomb calibration to percentlevel accuracy[C]Proceedings of the 37th International Free Electron Laser Conference (FEL’2015). Daejeon, Kea: Kea Atomic Energy Research Institute Pohang Accelerat Labaty, 2015: 118121.
[5] Choi H J, Chae M S, Kang H S, et al. Introduction to the test result of TurboICT in PALITF[C]Proceedings of the 3rd International Beam Instrumentation Conference (IBIC’14). Monterey, CA, USA: SLAC National Accelerat Labaty, 2014: 553557.
[6] TurboICT BCMRF Manual[EBOL].https:www.bergoz.comproductsturboict.
[7] STEMlab 12514[EBOL].https:redpitaya.comstemlab12514
[8] What do I need befe I start[EBOL]. https:redpitaya.readthedocs.ioenlatestquickStartneeds.html
[9] Lu Y H, He J. Virtual signal spectrum analyzer development based on Redpitaya epics f tune measurement in BEPCII[C]Proceedings of the 7th International Beam Instrumentation Conference (IBIC’18). Shanghai, China: Shanghai Institute of Applied Physics, 2018: 159161.
[10] redpitayaepics[EBOL].https:github.comAustralianSynchrotronredpitayaepics
[11] AsynDrivermanual[EBOL]. https:epics.anl.govmodulessoftasyn

Set citation alerts for the article
Please enter your email address
© Copyright 2018-2021 | Chinese Laser Press. All Rights Reserved 沪ICP备15018463号-20