
Jianzhi HONG, Biyun GUO, Yingchun FU, Huan NIE. Analytical Method for Man-Land Coupling Allometric Growth under the Background of New-type Urbanization [J]. Journal of Geo-information Science, 2020, 22(5): 1049
- Journal of Geo-information Science
- Vol. 22, Issue 5, 1049 (2020)
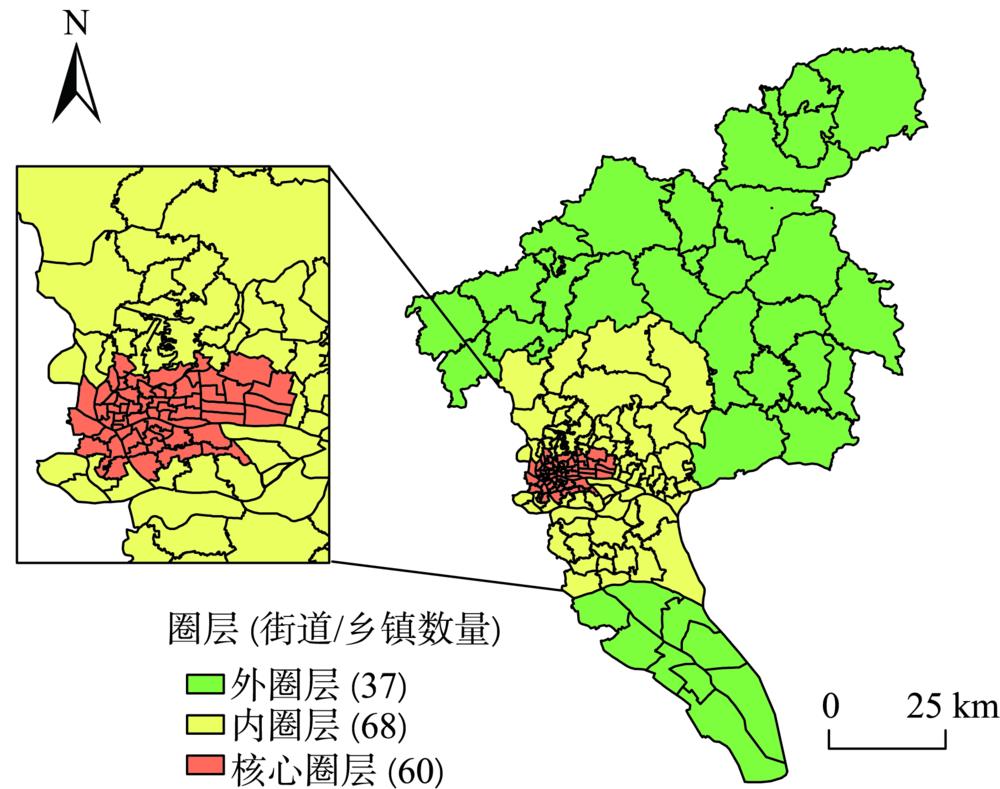
Fig. 1. Three-tier spatial structure in Guangzhou from 2000 to 2015
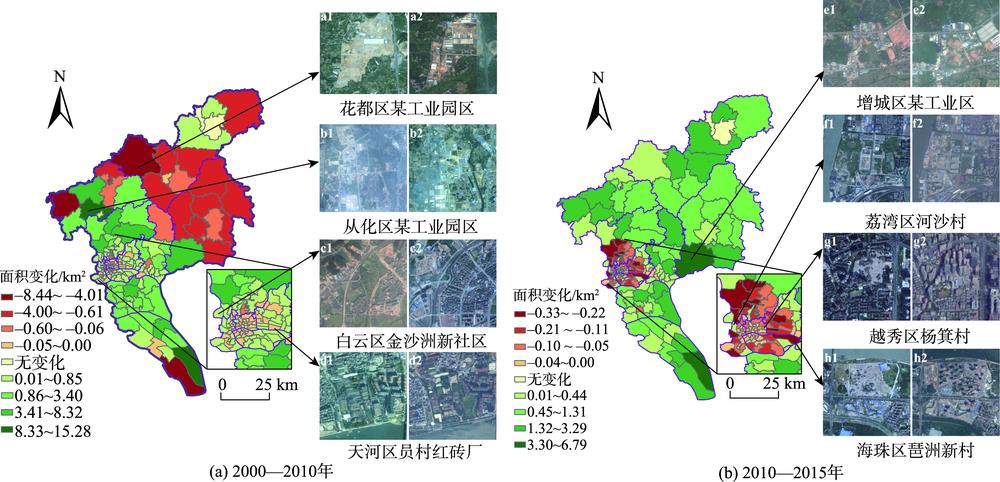
Fig. 2. Changes of built-up areas in Guangzhou from 2000 to 2015
Fig. 3. Allometric growth analysis process based on man-land coupling types
Fig. 4. Coupling types of population and land urbanization
Fig. 5. Statistics on the coupling types of population and land urbanization in Guangzhou from 2000 to 2015
Fig. 6. Spatial pattern of the coupling types of population and land urbanization in Guangzhou from 2000 to 2015
Fig. 7. Fitting of the allometric growth of urban population and land in Guangzhou in 2000, 2010 and 2015
Fig. 8. Allometric growth of coupling types of population and land urbanization in Guangzhou from 2000 to 2010
Fig. 9. Allometric growth of population and land urbanization in Guangzhou from 2010 to 2015
Fig. 10. Spatial pattern of allometric growth of population and land urbanization in Guangzhou from 2000 to 2015
|
Table 1. The explanation of data source
| |||||||||||||||||||||||||||||||||||||||||||||||||||||||||||||||||
Table 2. The change of urban population and built-up areas in Guangzhou from 2000 to 2015
|
Table 3. Allometric growth of coupling types of population and land urbanization in Guangzhou from 2000 to 2010
|
Table 4. Allometric growth of coupling types of population and land urbanization in Guangzhou from 2010 to 2015


Set citation alerts for the article
Please enter your email address

© Copyright 2018-2021 | Chinese Laser Press. All Rights Reserved 沪ICP备15018463号-20