• Chinese Optics Letters
  • Vol. 19, Issue 7, 071401 (2021)
Yinqi Wang1, Xiaoyue Wang1, Junsong Peng1, Ming Yan1、2、*, Kun Huang1、2、**, and Heping Zeng1、2、3
Author Affiliations
  • 1State Key Laboratory of Precision Spectroscopy, East China Normal University, Shanghai 200062, China
  • 2Chongqing Institute of East China Normal University, Chongqing 401147, China
  • 3Jinan Institute of Quantum Technology, Jinan 250101, China
  • show less
    DOI: 10.3788/COL202119.071401 Cite this Article Set citation alerts
    Yinqi Wang, Xiaoyue Wang, Junsong Peng, Ming Yan, Kun Huang, Heping Zeng. Experimental observation of transient mode-locking in the build-up stage of a soliton fiber laser[J]. Chinese Optics Letters, 2021, 19(7): 071401 Copy Citation Text show less
    Experimental setup. AOM, acoustic-optic modulator; LD, laser diode; EDF, erbium-doped fiber; OC, optical coupler; WDM/OI, wave division multiplexer and optical isolator; SMF, single-mode fiber; FPD, fast photo-detector; SESAM, semiconductor saturable absorber mirror; OSA, optical spectrum analyzer.
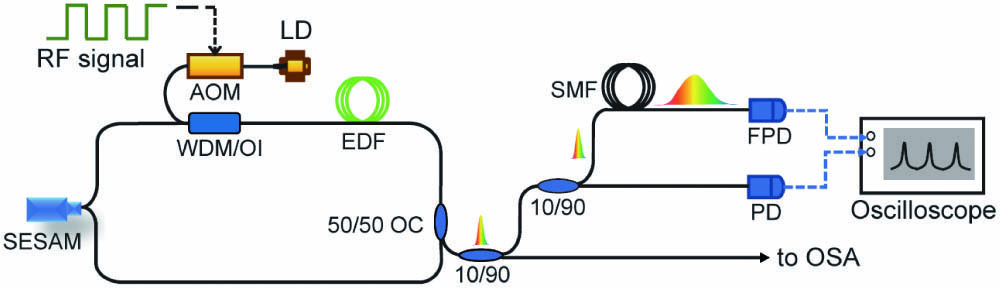
    Fig. 1. Experimental setup. AOM, acoustic-optic modulator; LD, laser diode; EDF, erbium-doped fiber; OC, optical coupler; WDM/OI, wave division multiplexer and optical isolator; SMF, single-mode fiber; FPD, fast photo-detector; SESAM, semiconductor saturable absorber mirror; OSA, optical spectrum analyzer.
    (a) A time sequence recorded in a TS-DFT measurement. A build-up regime for the fiber laser is displayed. (b) Zoom-in picture of the regime prior to a stable ML state. Spectra measured by TS-DFT (single-shot) and OSA are displayed in inset of (a) and the OSA data are also plotted in log scale (green) for showing the Kelly sidebands. The states labeled as A, B, and C are presented in Figs. 3, 4, and 5, respectively.
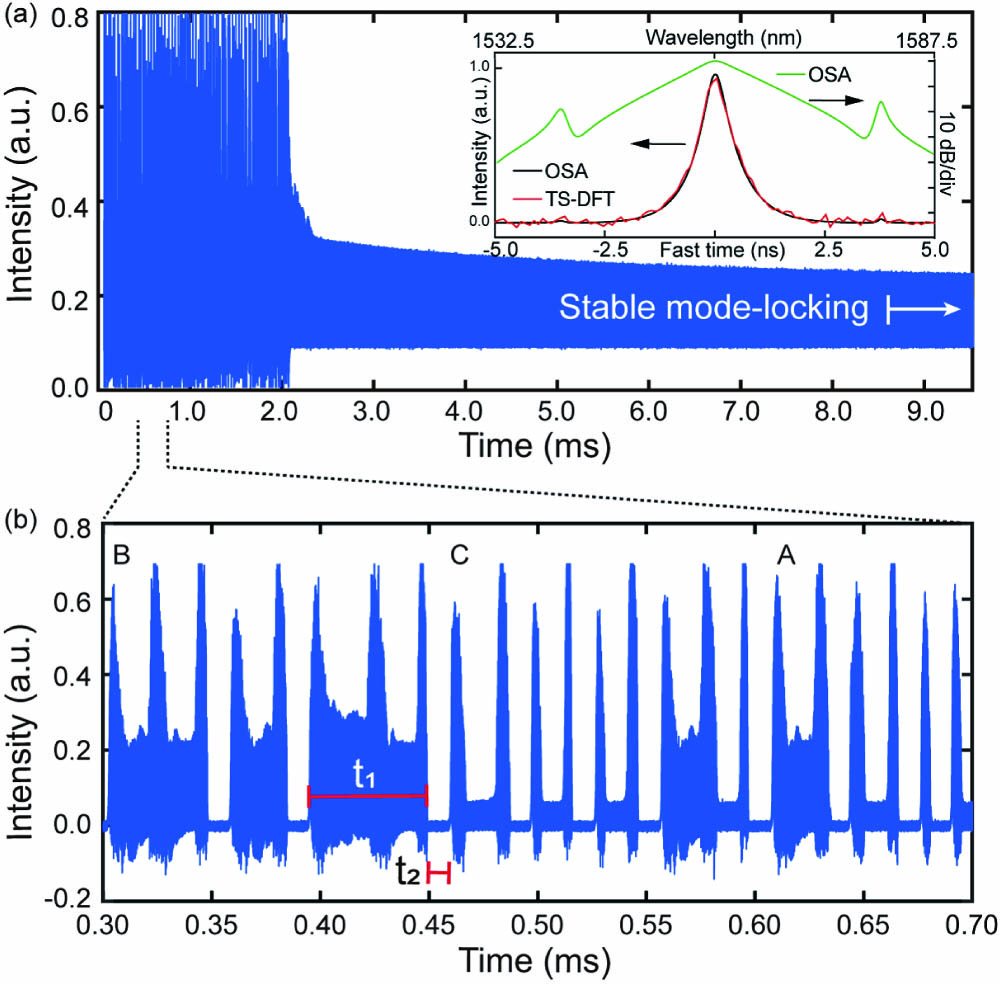
    Fig. 2. (a) A time sequence recorded in a TS-DFT measurement. A build-up regime for the fiber laser is displayed. (b) Zoom-in picture of the regime prior to a stable ML state. Spectra measured by TS-DFT (single-shot) and OSA are displayed in inset of (a) and the OSA data are also plotted in log scale (green) for showing the Kelly sidebands. The states labeled as A, B, and C are presented in Figs. 3, 4, and 5, respectively.
    (a) Time-domain sequence of a transient ML state and (b) the corresponding TS-DFT results displayed in a 2D map. (c) Zoom-in of (b) showing the spectral dynamics of the evolving pulses. (d) The field autocorrelation traces calculated with the Fourier transform of each TS-DFT spectrum in (b).
    Fig. 3. (a) Time-domain sequence of a transient ML state and (b) the corresponding TS-DFT results displayed in a 2D map. (c) Zoom-in of (b) showing the spectral dynamics of the evolving pulses. (d) The field autocorrelation traces calculated with the Fourier transform of each TS-DFT spectrum in (b).
    (a) Time-domain trace and (b) real-time spectral evolution measured with TS-DFT for a transient ML state. The y axis from 0 to 10 ns corresponds to a spectral scale from longer to shorter wavelengths. Note that for the transient states, the absolute values of wavelengths were not determined.
    Fig. 4. (a) Time-domain trace and (b) real-time spectral evolution measured with TS-DFT for a transient ML state. The y axis from 0 to 10 ns corresponds to a spectral scale from longer to shorter wavelengths. Note that for the transient states, the absolute values of wavelengths were not determined.
    (a) Recorded time-domain trace and (b) corresponding TS-DFT data for a different transient state. (c) An expanded view for the evolving solitons and (d) a three-dimensional image showing the spectral dynamics of the solitons.
    Fig. 5. (a) Recorded time-domain trace and (b) corresponding TS-DFT data for a different transient state. (c) An expanded view for the evolving solitons and (d) a three-dimensional image showing the spectral dynamics of the solitons.
    (a) Probability of occurrence for two typical transient ML states observed with different pump powers, which correspond to the results presented in Figs. 3 and 5. (b) The time-domain trace recorded in the onset of the fiber laser with reduced pump power.
    Fig. 6. (a) Probability of occurrence for two typical transient ML states observed with different pump powers, which correspond to the results presented in Figs. 3 and 5. (b) The time-domain trace recorded in the onset of the fiber laser with reduced pump power.
    Yinqi Wang, Xiaoyue Wang, Junsong Peng, Ming Yan, Kun Huang, Heping Zeng. Experimental observation of transient mode-locking in the build-up stage of a soliton fiber laser[J]. Chinese Optics Letters, 2021, 19(7): 071401
    Download Citation