• Chinese Physics B
  • Vol. 29, Issue 8, (2020)
Amin Raeisi1, Abbasali Bidokhti2、†, Seyed Mohammad Jafar Nazemosadat3, and Kamran Lari4
Author Affiliations
  • 1Faculty of Natural Resources and Environment, Science and Research Branch, Islamic Azad University, Tehran 477893855, Iran
  • 2Geophysics Institute, University of Tehran, Tehran 1417614418, Iran
  • 3Department of Water Engineering, Oceanic and Atmospheric Research Center, Shiraz University, Shiraz 71444165186, Iran
  • 4Department of Physical Oceanography, Faculty of Marine Science and Technology, Tehran North Branch, Islamic Azad University, Tehran 1987973133, Iran
  • show less
    DOI: 10.1088/1674-1056/ab96a3 Cite this Article
    Amin Raeisi, Abbasali Bidokhti, Seyed Mohammad Jafar Nazemosadat, Kamran Lari. Mesoscale eddies and their dispersive environmental impacts in the Persian Gulf[J]. Chinese Physics B, 2020, 29(8): Copy Citation Text show less
    (a) Map of the Persian Gulf region based on ETOPO2 data, depth in terms of meters.[4] (b) Water circulation in the Persian Gulf from August to November.[9]
    Fig. 1. (a) Map of the Persian Gulf region based on ETOPO2 data, depth in terms of meters.[4] (b) Water circulation in the Persian Gulf from August to November.[9]
    Height contours in the Persian Gulf for various seasons on (a) 19 August 2014 and (b) 12 February 2014.
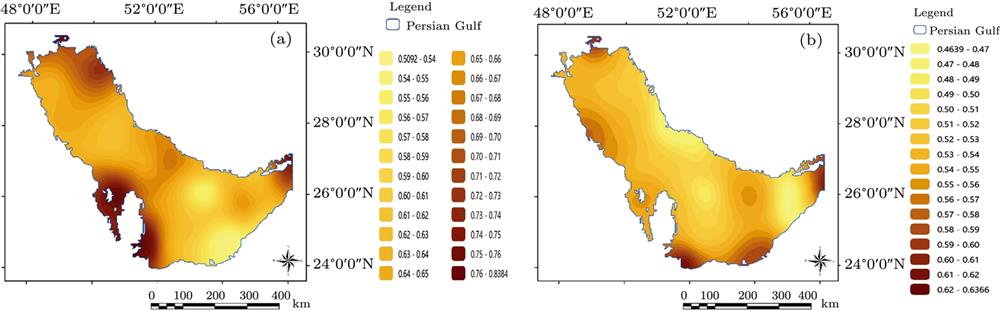
    Fig. 2. Height contours in the Persian Gulf for various seasons on (a) 19 August 2014 and (b) 12 February 2014.
    Histogram of the mean number of eddies in different months from 2010 to 2014.
    Fig. 3. Histogram of the mean number of eddies in different months from 2010 to 2014.
    Percentage of the monthly mean of eddies considering their polarity (2010–2014) (the red and blue histograms are assigned to anti-cyclonic and cyclonic eddies, respectively).
    Fig. 4. Percentage of the monthly mean of eddies considering their polarity (2010–2014) (the red and blue histograms are assigned to anti-cyclonic and cyclonic eddies, respectively).
    The dispersion histogram of the percentage of the mean of eddy diffusion coefficient over a tensile interval (the red and blue histograms are assigned to the anti-cyclonic and cyclonic eddies, respectively).
    Fig. 5. The dispersion histogram of the percentage of the mean of eddy diffusion coefficient over a tensile interval (the red and blue histograms are assigned to the anti-cyclonic and cyclonic eddies, respectively).
    Maps showing the place of eddies in winter (a) and summer (b) 2014 (the cyclonic and anti-cyclonic eddies with the highest diffusion coefficient are represented by five-pointed blue and red stars, respectively).
    Fig. 6. Maps showing the place of eddies in winter (a) and summer (b) 2014 (the cyclonic and anti-cyclonic eddies with the highest diffusion coefficient are represented by five-pointed blue and red stars, respectively).
    The contour maps showing eddy diffusion coefficients in summer (2014) (the high-risk areas are marked with a number).
    Fig. 7. The contour maps showing eddy diffusion coefficients in summer (2014) (the high-risk areas are marked with a number).
    (a) and (b) Maps extracted from simulations provided by Thoppil and Hugan[8] (left) and SSH maps plotted based on AVISO data (right).
    Fig. 8. (a) and (b) Maps extracted from simulations provided by Thoppil and Hugan[8] (left) and SSH maps plotted based on AVISO data (right).
    SpringSummerAutumnWinterTotal
    Cyclonic62.10%58.60%55.90%60.90%59.10%
    Anti-cyclonic37.90%41.40%44.10%39.10%40.90%
    Table 1. Percentage of the seasonal mean of eddies considering the polarity (2010–2014).
    SeasonNumber of eddiesLeff/kmkxy/(m2/s)Lifetime/weekDate of event
    Winter20102.9576.70126 February
    2(AC)105.2754.2125 December
    1865.7953.1535 March
    2173.8852.33126 February
    Spring2148.3487.2533 June
    2185.5982.68327 May
    2452.7969.35110 June
    1349.8662.8516 May
    Summer453.79116.81415 July
    395.69108.6728 July
    1102.42108.09215 July
    960.12107.0162 September
    Autumn577.8079.11321 October
    3463.1472.53123 December
    14(AC)57.5169.9342 December
    32(AC)47.2568.08123 December
    Table 2. Eddies with the highest diffusion coefficients kxy (2014).
    Number of areaArea/km2The mean of diffusion coefficient in the target area/(m2/s)Location
    Longitude/degreeLatitude/degree
    fromtofromto
    115220.9978.0525.7827.5751.3853.82
    22443.0976.0225.7426.4253.4253.98
    34573.5570.0825.5126.154.3755.28
    43901.5965.2327.5728.4048.9250.21
    Table 3. Areas of eddy occurrence along with the mean of diffusion coefficients in summer (2014).
    Amin Raeisi, Abbasali Bidokhti, Seyed Mohammad Jafar Nazemosadat, Kamran Lari. Mesoscale eddies and their dispersive environmental impacts in the Persian Gulf[J]. Chinese Physics B, 2020, 29(8):
    Download Citation