• Chinese Journal of Lasers
  • Vol. 45, Issue 8, 811002 (2018)
Tan Bing, Huang Min*, Zhu Qibing, Guo Ya, and Zhang Hongyang
Author Affiliations
  • [in Chinese]
  • show less
    DOI: 10.3788/CJL201845.0811002 Cite this Article Set citation alerts
    Tan Bing, Huang Min, Zhu Qibing, Guo Ya, Zhang Hongyang. Method on Elements Automatic Identification of Spectral Peaks in Laser-Induced Breakdown Spectroscopy[J]. Chinese Journal of Lasers, 2018, 45(8): 811002 Copy Citation Text show less
    Diagram of overlapping spectrum
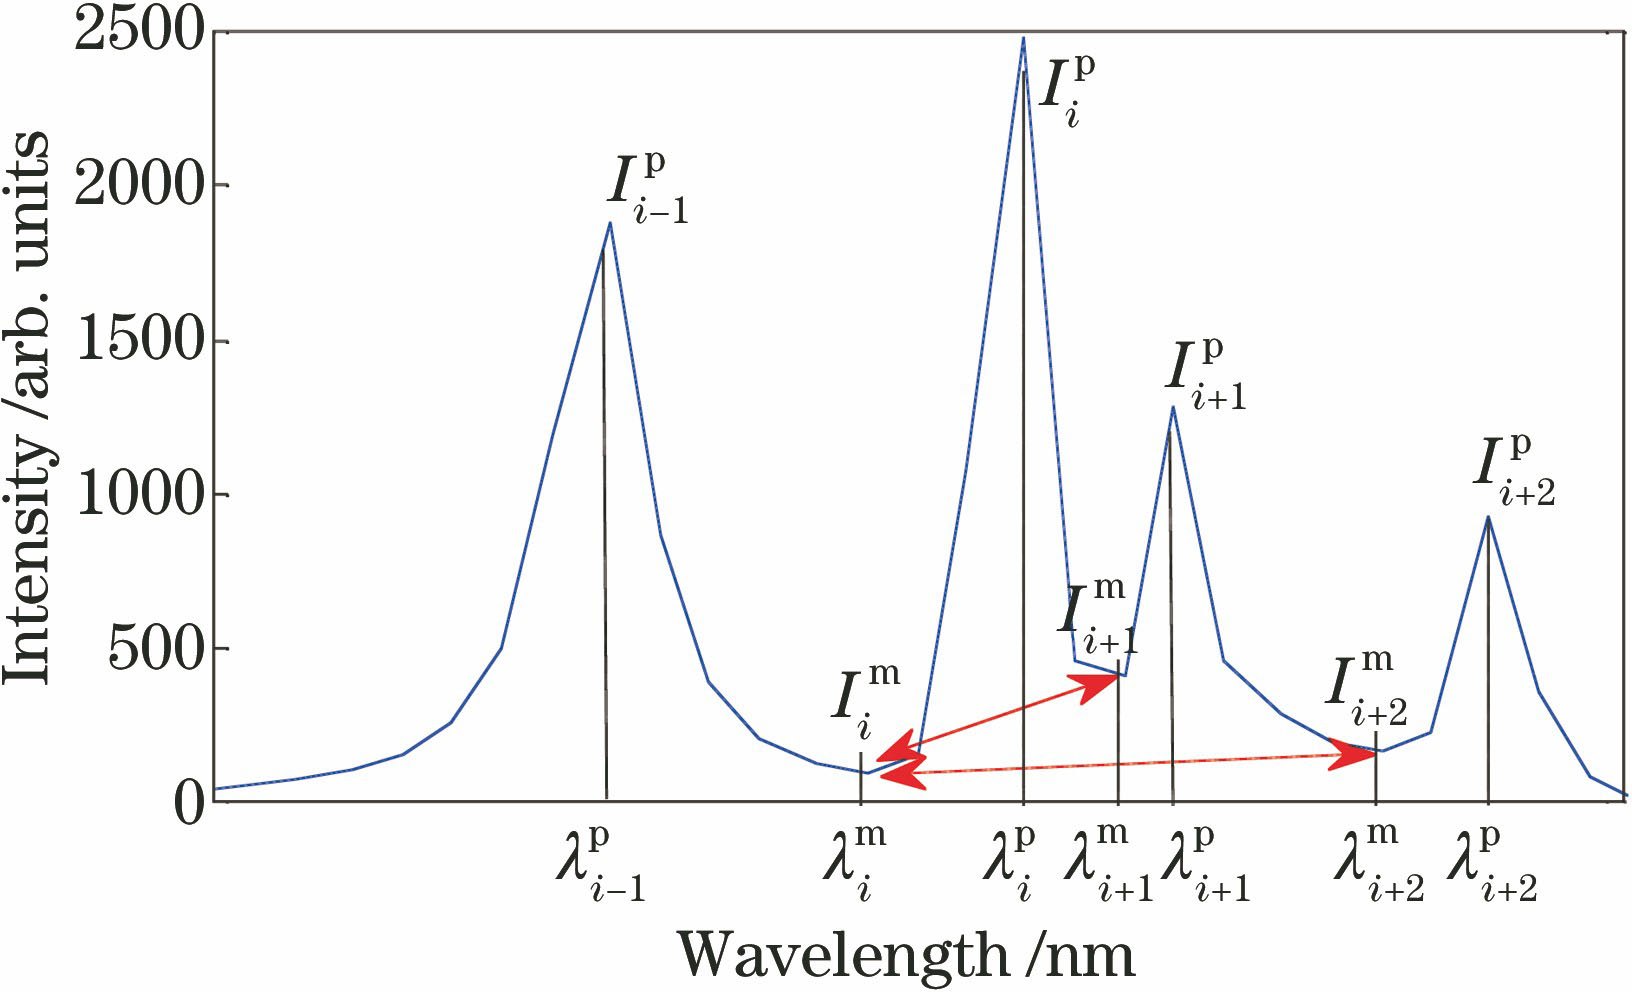
    Fig. 1. Diagram of overlapping spectrum
    Simulated spectrum
    Fig. 2. Simulated spectrum
    (a) Spectrum after background correction; (b) spectrum after decomposition and reconstitution with Voigt function; (c) recognition results with the proposed method; (d) recognition results with window sliding correlation analysis method
    Fig. 3. (a) Spectrum after background correction; (b) spectrum after decomposition and reconstitution with Voigt function; (c) recognition results with the proposed method; (d) recognition results with window sliding correlation analysis method
    Recognition results of the spectrum of Longjing green tea. (a) Background correction and spectral decomposition; (b) recognition results
    Fig. 4. Recognition results of the spectrum of Longjing green tea. (a) Background correction and spectral decomposition; (b) recognition results
    lgNeT /eVAveragesimilarityRecognitionnumberlg(Ne)T /eVAveragesimilarityRecognitionnumber
    150.50.692627180.50.615824
    150.750.659825180.750.633625
    1510.6466251810.640625
    151.250.672026181.250.691927
    151.50.650125181.50.628824
    151.750.622824181.750.619124
    1520.5994241820.603924
    160.50.663926190.50.617024
    160.750.632025190.750.653026
    1610.6512251910.667826
    161.250.619324191.250.608524
    161.50.621624191.50.605824
    161.750.632025191.750.601824
    1620.6921271920.597724
    170.50.618324200.50.626124
    170.750.636724200.750.643725
    1710.6639252010.693729
    171.250.675626201.250.680626
    171.50.688326201.50.678226
    171.750.683827201.750.623924
    1720.6929282020.610724
    Table 1. Spectral peaks recognition results for simulating spectrum at different Ne and T
    Spectral peakSuspected elements and their similarity
    1(247.85 nm)CC=0.9224R=0.8163FeC=0.3594R=0.2790MnC=0.1069R=0.1258CrC=0.1887R=0.0692CoC=0.2255R=0.0816HgC=0.1073R=0.1008WC=0.0694R=0.0311
    2(238.17 nm)FeC=0.9068R=0.6375LiC=0.1667R=0.1794MnC=0.3223R=0.3522CrC=0.1581R=0.2265CoC=0.0176R=0.0805CsC=0.0249R=0.0302WC=0.0316R=0.0647
    3(248.31 nm)FeC=0.9671R=0.8990MnC=0.1513R=0.4213CrC=0.4086R=0.1008TiC=0.2390R=0.2790CoC=0.0625R=0.0618TcC=0.0324R=0.0816HgC=0.0309R=0.0311
    4(249.07 nm)NaC=0.8065R=0.7604CrC=0.5577R=0.5780FeC=0.4125R=0.4961MnC=0.1525R=0.4254CoC=0.1264R=0.2267CdC=0.1308R=0.2158WC=0.0675R=0.1861
    5(239.48 nm)LiC=0.7447R=0.4574MnC=0.2373R=0.2451FeC=0.3514R=0.2950CoC=0.2375R=0.1133TiC=0.1252R=0.1490SbC=0.0123R=0.1490WC=0.0076R=0.1091
    Table 2. Recognition results of spectral peak
    Tan Bing, Huang Min, Zhu Qibing, Guo Ya, Zhang Hongyang. Method on Elements Automatic Identification of Spectral Peaks in Laser-Induced Breakdown Spectroscopy[J]. Chinese Journal of Lasers, 2018, 45(8): 811002
    Download Citation