• Geographical Research
  • Vol. 39, Issue 7, 1654 (2020)
Zhizhong NING1, Ting WANG1、*, and Xuechun YANG2
Author Affiliations
  • 1Institute of Geographic Sciences and Natural Resources Research, CAS, Beijing 100101, China
  • 2College of Resource Environment and Tourism, Capital Normal University, Beijing 100048, China
  • show less
    DOI: 10.11821/dlyj020190452 Cite this Article
    Zhizhong NING, Ting WANG, Xuechun YANG. Spatio-temporal evolution of tourist attractions and formation of their clusters in China since 2001[J]. Geographical Research, 2020, 39(7): 1654 Copy Citation Text show less
    Spatial distribution of A-grade tourist attractions of China in 2001-2016
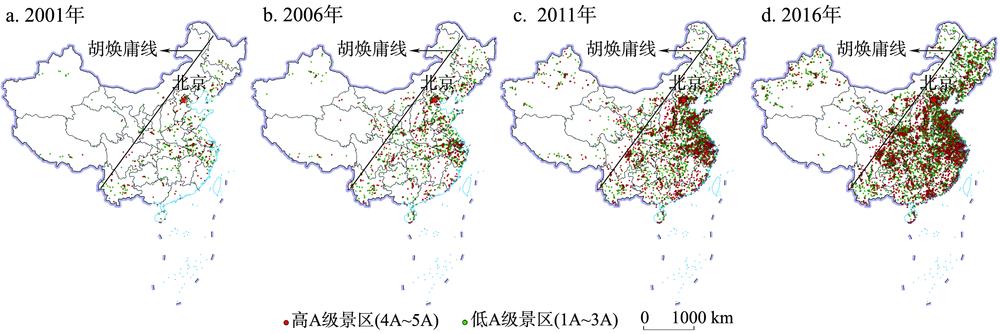
    Fig. 1. Spatial distribution of A-grade tourist attractions of China in 2001-2016
    Standard deviation elliptic variogram of A-grade tourist attractions of China in 2001-2016
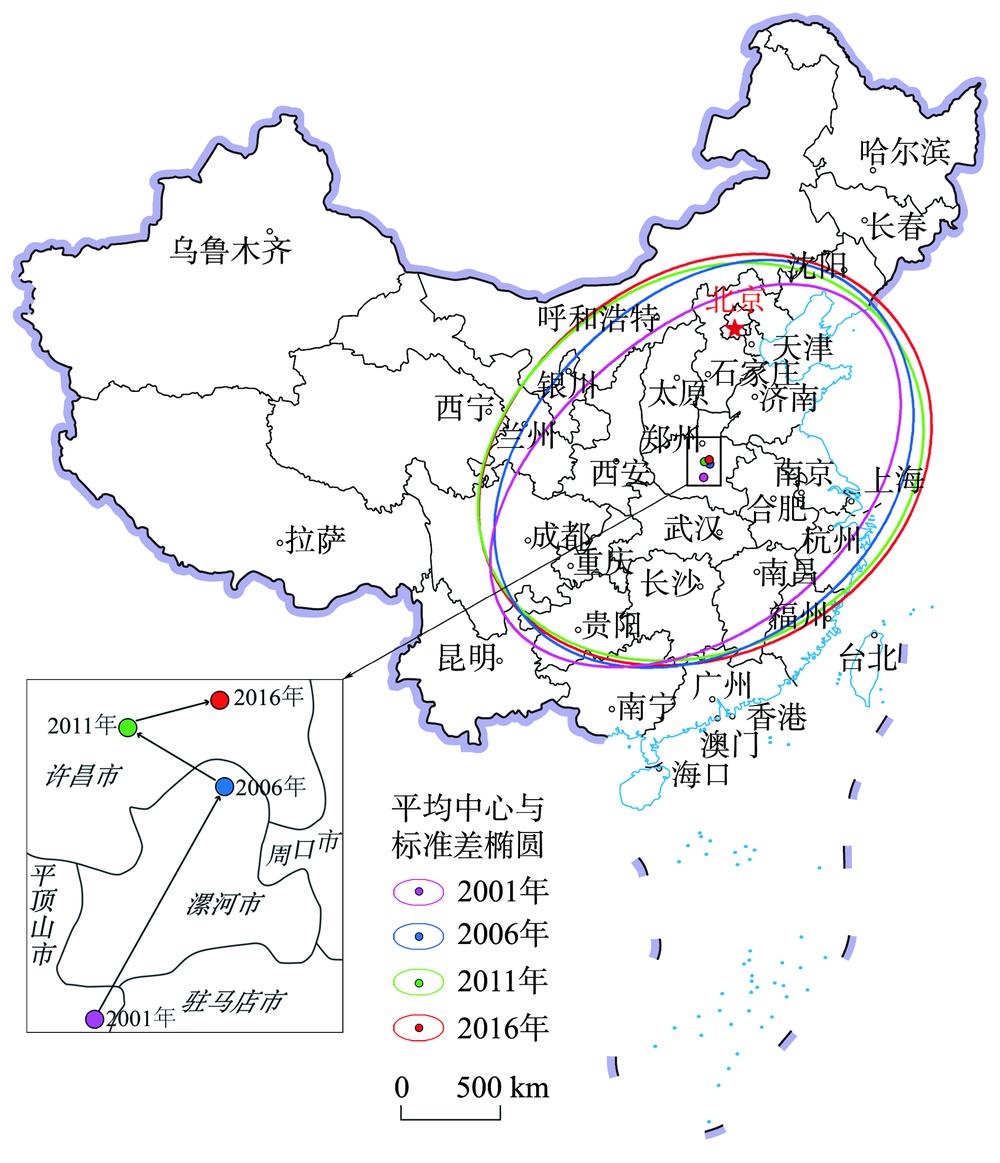
    Fig. 2. Standard deviation elliptic variogram of A-grade tourist attractions of China in 2001-2016
    Kernel density of A-grade tourist attractions of China in 2001-2016
    Fig. 3. Kernel density of A-grade tourist attractions of China in 2001-2016
    Nearest neighbor index of A-grade tourist attractions of China in 2001-2016
    Fig. 4. Nearest neighbor index of A-grade tourist attractions of China in 2001-2016
    The relationship between the kernel density of A-grade tourist attractions of China and the per capita GDP of each province in 2016
    Fig. 5. The relationship between the kernel density of A-grade tourist attractions of China and the per capita GDP of each province in 2016
    Spatio-temporal evolution of the kernel density of Beijing and South Jiangsu tourist attraction clusters in 2001-2016
    Fig. 6. Spatio-temporal evolution of the kernel density of Beijing and South Jiangsu tourist attraction clusters in 2001-2016
    The layer structure of kernel density of tourist attraction clusters of China in 2016
    Fig. 7. The layer structure of kernel density of tourist attraction clusters of China in 2016
    总数量5A4A3A2A1A
    2001年550018710821342
    2006年1740062352653160
    2011年5573130181418401661128
    2016年9820228303341102344105
    Table 1. [in Chinese]
    胡焕庸线以东胡焕庸线以西
    景区数量(个)占比(%)景区数量(个)占比(%)
    2001年48988.916111.09
    2006年150386.3823713.62
    2011年484686.9672713.04
    2016年861287.70120812.30
    Table 2. The number of tourist attractions of China on the east and west sides of Hu Line
    2001年2006年2011年2016年
    中心坐标113.699°E, 33.249°N114.082°E, 33.822°N113.802°E, 33.963°N114.073°E, 34.036°N
    移动方向北偏东西北东偏北
    移动距离(km)72.932730.226826.2666
    Table 3. Gravity change of A-grade tourist attractions of China
    2001年2006年2011年2016年
    生成椭圆面积(km2280.672324.883346.299363.110
    转角θ(°)64.13666.65576.57175.081
    沿x轴标准差(km)7.2158.3888.7318.959
    沿y轴标准差(km)12.38412.33012.62612.902
    扁率0.4170.3200.3080.305
    Table 4. The parameters calculation results of standard deviation ellipse
    10~2020~4040~6060~8080~100>100
    2001年31
    2006年1531
    2011年201622
    2016年192211622
    Table 5. [in Chinese]
    北京景区群苏南景区群合计
    数量(个)占全国景区数量比例(%)接待量(亿人次)占全国景区接待量比例(%)数量(个)占全国景区数量比例(%)接待量(亿人次)占全国景区接待量比例(%)占全国景区数量比例(%)占全国景区接待量比例(%)
    2001年853.751.196.141175.161.588.158.9114.29
    2006年1032.511.394.701854.512.197.407.0212.10
    2011年1432.571.774.312944.473.217.757.0412.06
    2016年1992.031.813.533463.523.697.115.5510.64
    Table 6. The quantity and reception of Beijing and South Jiangsu tourist attraction clusters
    Zhizhong NING, Ting WANG, Xuechun YANG. Spatio-temporal evolution of tourist attractions and formation of their clusters in China since 2001[J]. Geographical Research, 2020, 39(7): 1654
    Download Citation