
Qin Wen, Wenwen Cui, Yong Geng, Heng Zhou, Kun Qiu. Precise control of micro-rod resonator free spectral range via iterative laser annealing[J]. Chinese Optics Letters, 2021, 19(7): 071903
- Chinese Optics Letters
- Vol. 19, Issue 7, 071903 (2021)
Abstract
1. Introduction
Microresonators, which combine high quality (Q) factor and small mode volume, enhance light–matter interaction dramatically, making it an ideal platform to study nonlinear optical effects[
For decades, DKSs have been realized with various materials and machining techniques, with a repetition frequency ranging from several gigahertz (GHz) to terahertz (THz)[
In this Letter, we present a novel method to control the FSR of silica micro-rod resonators precisely. Through the laser annealing process, in which a laser beam is employed to machine on the already-fabricated resonators for an appropriate duration, precise control of the FSR is realized, and the ultrahigh Q-factor is maintained. Single-DKS microcombs are generated in these FSR-optimized resonators after the iterative annealing process, and their repetition frequencies are measured to verify the effectiveness of the proposed method.
Sign up for Chinese Optics Letters TOC. Get the latest issue of Chinese Optics Letters delivered right to you!Sign up now
2. FSR Optimization with Laser Annealing
The so-called micro-rod resonators we employed were firstly, to the best of our knowledge, presented by the National Institute of Standards and Technology (NIST), which have the advantages of rapid fabrication and ultrahigh Q-factor[
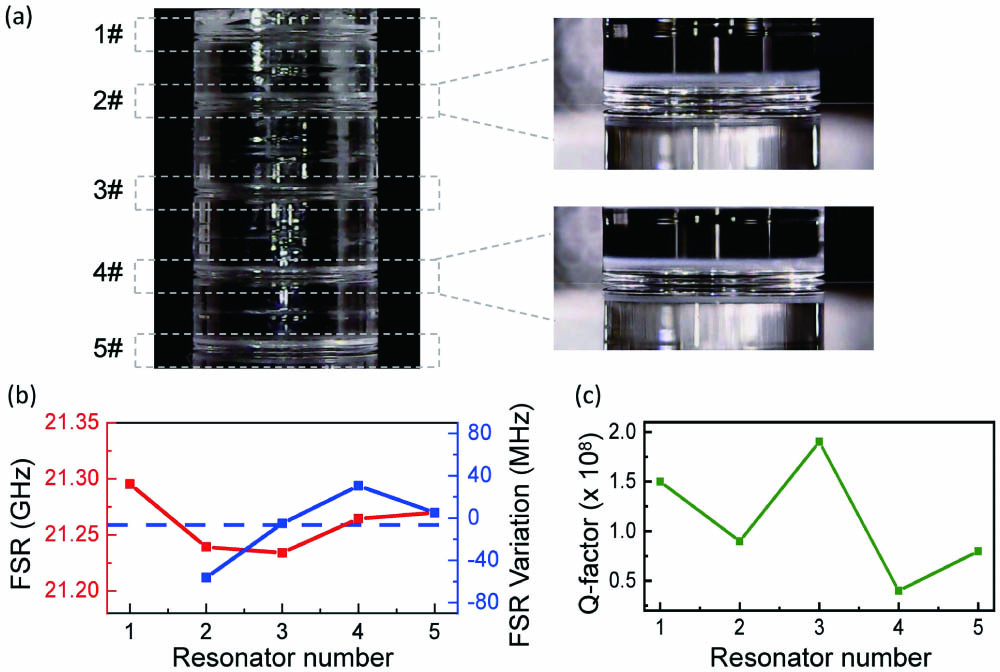
Firstly, we investigated the fabrication errors of our resonator fabrication system through fabricating five resonators on a single silica rod preform successively. The resonators were fabricated with the same machining parameters. The diameter of the selected silica rod preform is about 3 mm, corresponding to an FSR of about 22 GHz. The shapes of the resonators’ sidewalls are similar, as shown in the zoom-in photographs of two resonators in Fig. 1(a). As shown in Fig. 1(b), the FSRs of the five resonators range from 21.30 GHz to 21.23 GHz, indicating that the FSR variation is random and can be greater than 60 MHz. The result shows the typical FSR variation induced by fabrication errors. Meanwhile, as shown in Fig. 1(c), the Q-factors of these five resonators have also been measured and show a random characteristic. It is seen that the Q-factor of these resonators is about , which is necessary for DKS microcomb generation with relatively low power of the pump laser.
![]()
Figure 1.(a) Photographs of the five micro-rod resonators fabricated on a single silica rod preform and the microscopy images of two resonators (2 and 4). (b) The FSRs and the FSR variation between every two resonators fabricated successively. (c) The Q-factors of the five fabricated resonators.
Therefore, to obtain identical resonators with similar FSR, it is necessary to remove the fabrication errors from already-fabricated resonators while the Q-factor is just slightly affected. To overcome this challenge, we propose to apply another laser annealing process on already-fabricated resonators to realize a fine decrease of resonator diameter, just like we applied during the resonator fabrication process. Concretely, during the laser annealing process, the resonator surface is melted, and the shape of the resonator sidewall is changed with the volatilization of the silica. After the laser annealing process, the curvature of the resonator sidewall will be decreased slightly, inducing a fine decrease of resonator diameter. Eventually, by applying the laser annealing process iteratively, the FSR can be optimized to the target value. Importantly, in this method, the laser annealing time plays a key role in FSR tuning resolution. Theoretically, shorter annealing time can result in higher FSR tuning resolution and will be experimentally studied below.
To verify the feasibility of the proposed method, we conducted an experiment to optimize the FSR of an already-fabricated resonator repeatedly for up to five times, and the resonator is characterized after each annealing process. During the measurement, we kept the parameter of laser annealing process constant for every FSR optimizing process. Appropriate fabrication and coupling tactics were applied to excite just a few modes efficiently. Ordinarily, in the measurement, we focus on the cavity mode with maximum Q-factor value among all excited modes. Note that, after the laser annealing process, the excited mode spectrum will be slightly affected. To ensure that the cavity mode we focused can be excited, precise coupling and polarization adjustments were made after each annealing process. The annealing processes were repeated five times iteratively on the same resonator to verify its repeatability over a relatively long period of time. The transmission spectra for the resonator fabricated initially, annealed once, and annealed four times iteratively are shown in Figs. 2(a)–2(c), respectively. With the aforementioned measures, the spectral peaks of the target modes can be identified clearly in the transmission spectra, marked by black solid rectangles in Figs. 2(a)–2(c). A sideband technique was applied to ensure the FSR measuring accuracy[
![]()
Figure 2.(a)–(c) Transmission spectra of the resonator fabricated initially, annealed once, and annealed four times iteratively. The spectral peaks of the target modes are marked by black solid rectangles. The arrow lines mark the FSRs of the target modes. (d)–(f) Expanded plots of the spectral peaks of target modes, marked by black solid rectangles in (a)–(c). (g) The FSRs and the FSR variations vary with the number of iterative annealing processes. The dotted line represents the average value of FSR variation. (h) The Q-factor varies with the number of iterative annealing processes.
As the modulation frequency generated with RF synthesizer is extremely precise, the measurement error of the FSR is mainly contributed by the measurement error of , which can be minimized by using a Mach–Zehnder interferometer (MZI) as a reference spectrum. In the experiments, as the modulation frequency was set to a constant value of 21.8 GHz, the variation of the offset frequency equaled the FSR variation. As shown in Figs. 2(d)–2(f), the offset frequency increases with the increasing number of iterative annealing processes, meaning that the FSR is getting larger. The measured FSRs and FSR variation are shown in Fig. 2(g). The FSR nearly increases in a linear relationship with the number of iterative annealing processes. The average FSR variation is about 24.9 MHz, while its standard deviation can be calculated to be about 1.48 MHz, showing favorable repeatability.
Another thing we focused on is the impact on the Q-factor after the iterative annealing processes, as it will influence the threshold power for comb formation. As shown in Fig. 2(h), the Q-factor slightly fluctuates with the increase of the number of iterative annealing processes. It degrades by about 20% from the initial value, but still maintains an ultrahigh state. The equation of microresonator parametric oscillation threshold is given by[
As mentioned above, the laser annealing time plays a key role in this method. To find out the highest precision of this method, we gradually reduced the annealing time from 30 to 10 s. For a certain annealing time, the annealing processes were repeated five times to minimize the influence of accidental errors, just as what we have performed in the experiments when annealing for 30 s. As the result shows in Fig. 3, the average FSR variation increases as the annealing time is lengthened. The minimum FSR variation is about 2.1 MHz with an annealing time of 10 s, while the maximum FSR variation is about 24.9 MHz with an annealing time of 30 s. The best resolution is smaller than 5 MHz, indicating that the FSR value (22 GHz) can be changed within 0.02%. The standard deviation of the FSR variation in experiments with different annealing times is below 1.5 MHz, verifying favorable stability and repeatability of the optimization method. On the other side, the impact on the Q-factor is also a matter of concern. For comparing the change trends with different annealing times, the initial resonators with a Q-factor of about were fabricated in the experiments with different annealing times. It can be seen from Fig. 3 that the Q-factor decreases with the shortening of the annealing time. It can be explained as the worst melting uniformity of the resonator surface when annealing with a shorter time. The standard deviation of the Q-factor is remarkably smaller, with an annealing process of 30 s, than others, showing a better ability to maintain an ultrahigh Q-factor. However, while the Q-factor is greater than in most cases, the influence of larger standard deviation of the Q-factor is limited.
![]()
Figure 3.Average FSR variation and average Q-factor vary with annealing time.
3. Soliton Generation Using Optimized Cavity
Precise control of resonator FSR is achieved by applying an iterative laser annealing process on already-fabricated resonators, and these optimized micro-rod resonators are ideal candidates for generating single-DKS with the target repetition frequency. Figure 4(a) gives the schematic of our experimental setup for soliton generation in resonators. An auxiliary laser heating method was adapted to overcome the thermal nonlinear effect of the microresonator and stably access single-DKS microcombs state[
![]()
Figure 4.(a) Experimental setup of single-DKS microcomb generation via auxiliary laser heating in micro-rod resonator. CW, continuous-wave narrow linewidth tunable fiber laser; AOM, acoustic optical modulator; EDFA, erbium-doped fiber amplifier; FPC, fiber polarization controller; FBG, fiber Bragg grating; PM, power measuring instrument; ESA, electrical spectrum analyzer; OSA, optical spectrum analyzer. (b)–(d) Optical spectra of the three single-DKS microcombs generated with a micro-rod resonator fabricated initially, annealed once, and annealed twice iteratively with 20 s annealing time. (e) RF beat note spectra of three single-DKS microcombs shown in (b)–(d).
We conducted this experiment by using an optimized resonator with 20 s annealing process that characterized a 10 MHz resolution. The optical spectra of single-DKS generated in the resonator fabricated initially, annealed once, and annealed twice iteratively are presented in Figs. 4(b)–4(d). The three microcombs were generated with similar pump laser power of about 20 dBm, and the width of three optical DKS spectra covered a similar span of 25–30 nm around 1550 nm. The envelopes of the optical spectra in Figs. 4(b) and 4(d) show some imperfections, which are induced by avoided mode crossing[
4. Conclusion
In conclusion, we present a simple and effective method to control the FSR of micro-rod resonators precisely. We fabricated five resonators on a single silica rod preform firstly, to investigate the FSR variation caused by fabrication error, which indicated the order of magnitude of the FSR difference that needs to be optimized precisely. The optimization scheme was proposed, and the measuring method and feasibility were analyzed then. Afterward, the impacts of the annealing process with different durations on FSR variation and Q-factor were experimentally investigated. To verify its application potential, single-DKS microcombs were generated, and their repetition frequencies were measured. It has been proved that through the iterative laser annealing process, the repetition frequency of the generated single-DKS microcomb can be optimized with a precision of about 10 MHz. Our research results can extend the application scenarios of micro-rod resonators greatly.
References
[1] K. J. Vahala. Optical microcavities. Nature, 424, 839(2003).
[3] W. Xu, C. X. Xu, F. F. Qin, Y. Q. Shan, Z. Zhu, Y. Zhu. Whispering-gallery mode lasing from polymer microsphere for humidity sensing. Chin. Opt. Lett., 16, 081401(2018).
[4] K. W. Yang, H. L. Gong, X. L. Shen, Q. Hao, M. Yan, K. Huang, H. P. Zeng. Temperature measurement based on adaptive dual-comb absorption spectral detection. Chin. Opt. Lett., 18, 051401(2020).
[5] T. J. Kippenberg, A. L. Gaeta, M. Lipson, M. L. Gorodetsky. Dissipative Kerr solitons in optical microresonators. Science, 361, 6402(2018).
[6] S. A. Diddams, T. Udem, J. C. Bergquist, E A. Curtis, R. E. Drullinger, L. Hollberg, W. M. Itano, W. D. Lee, C. W. Oates, K. R. Vogel, D. J. Wineland. An optical clock based on a single trapped 199Hg+ ion. Science, 293, 825(2001).
[7] N. R. Newbury. Searching for applications with a fine-tooth comb. Nat. Photon., 5, 186(2011).
[8] T. M. Fortier, M. S. Kirchner, F. Quinlan, J. Taylor, J. C. Bergquist, T. Rosenband, N. Lemke, A. Ludlow, Y. Jiang, C. W. Oates, S. A. Diddams. Generation of ultrastable microwaves via optical frequency division. Nat. Photon., 5, 425(2011).
[9] X. Xie, R. Bouchand, D. Nicolodi, M. Giunta, W. Hänsel, M. Lezius, A. Joshi, S. Datta, C. Alexandre, M. Lours, P. A. Tremblin, G. Santarelli, R. Holzwarth, Y. Le Coq. Photonic microwave signals with zeptosecond-level absolute timing noise. Nat. Photon., 11, 44(2017).
[10] D. T. Spencer, T. Drake, T. C. Briles, J. Stone, L. C. Sinclair, C. Fredrick, Q. Li, D. Westly, B. R. Ilic, A. Bluestone, N. Volet, T. Komljenovic, L. Chang, S. H. Lee, D. Y. Oh, M. G. Suh, K. Y. Yang, M. H. P. Pfeiffer, T. J. Kippenberg, E. Norberg, L. Theogarajan, K. Vahala, N. R. Newbury, K. Srinivasan, J. E. Bowers, S. A. Diddams, S. B. Papp. An integrated-photonics optical-frequency synthesizer. Nature, 557, 81(2018).
[11] P. Marin-Palomo, J. N. Kemal, M. Karpov, A. Kordts, J. Pfeifle, M. H. Pfeiffer, P. Trocha, S. Wolf, V. Brasch, M. H. Anderson, R. Rosenberger, K. Vijayan, W. Freude, T. J. Kippenberg, C. Koos. Microresonator-based solitons for massively parallel coherent optical communications. Nature, 546, 274(2017).
[12] T. Ideguchi, S. Holzner, B. Bernhardt, G. Guelachvili, N. Picqué, T. W. Hänsch. Coherent Raman spectro-imaging with laser frequency combs. Nature, 502, 355(2013).
[13] M.-G. Suh, Q. Yang, K. Yang, X. Yi, K. J. Vahala. Microresonator soliton dual-comb spectroscopy. Science, 354, 600(2016).
[14] N. G. Pavlov, G. Lihachev, S. Koptyaev, E. Lucas, M. Karpov, N. M. Kondratiev, I. A. Bilenko, T. J. Kippenberg, M. L. Gorodetsky. Soliton dual frequency combs in crystalline microresonators. Opt. Lett., 42, 514(2017).
[16] P. Del’Haye, S. A. Diddams, S. B. Papp. Laser-machined ultra-high-Q microrod resonators for nonlinear optics. Appl. Phys. Lett., 102, 221119(2013).
[17] J. Li, H. Lee, K. Y. Yang, K. J. Vahala. Sideband spectroscopy and dispersion measurement in microcavities. Opt. Express, 20, 26337(2012).
[18] A. B. Matsko, A. A. Savchenkov, D. Strekalov, V. S. Ilchenko, L. Maleki. Optical hyperparametric oscillations in a whispering-gallery-mode resonator: threshold and phase diffusion. Phys. Rev. A, 71, 033804(2005).
[19] H. Zhou, Y. Geng, W. Cui, S. Huang, Q. Zhou, K. Qiu, C. Wong. Soliton bursts and deterministic dissipative Kerr soliton generation in auxiliary-assisted microcavities. Light: Sci. Appl., 8, 1(2019).
[20] T. Herr, V. Brasch, J. Jost, I. Mirgorodskiy, G. Lihachev, M. Gorodetsky, T. Kippenberg. Mode spectrum and temporal soliton formation in optical microresonators. Phys. Rev. Lett., 113, 123901(2014).
[21] C. Bao, P. Liao, A. Kordts, M. Karpov, M. H. Pfeiffer, L. Zhang, Y. Cao, G. Xie, C. Liu, Y. Yan, A. Almaiman, A. Mohajerin-Ariaei, A. Fallahpour, M. Tur, T. J. Kippenberg, E. Willner. Soliton repetition rate in a silicon-nitride microresonator. Opt. Lett., 42, 759(2017).

Set citation alerts for the article
Please enter your email address
© Copyright 2018-2021 | Chinese Laser Press. All Rights Reserved 沪ICP备15018463号-20