• Chinese Physics B
  • Vol. 29, Issue 8, (2020)
Wen-Lei Zhao1、† and Quanlin Jie2
Author Affiliations
  • 1School of Science, Jiangxi University of Science and Technology, Ganzhou 34000, China
  • 2Department of Physics, Wuhan University, Wuhan 43007, China
  • show less
    DOI: 10.1088/1674-1056/ab8a3a Cite this Article
    Wen-Lei Zhao, Quanlin Jie. Quantum to classical transition induced by a classically small influence[J]. Chinese Physics B, 2020, 29(8): Copy Citation Text show less
    Classical diffusion coefficient Dc of particle 1 versus m for ε = 0.1 (triangles), 2 (squares), and 4 (circles). The dashed line (in red) denotes the classical diffusion coefficient of unperturbed case, i.e., ε = 0. Inset: mean square of classical momentum of particle 1 versus time for m = 0.001. Dashed line (in red) denotes the fitting function of the form 〈p12(t)〉=Dct with Dc = 0.087. The parameters are K1 = 1.8, K2 = 0, λ = 10, and L = π.
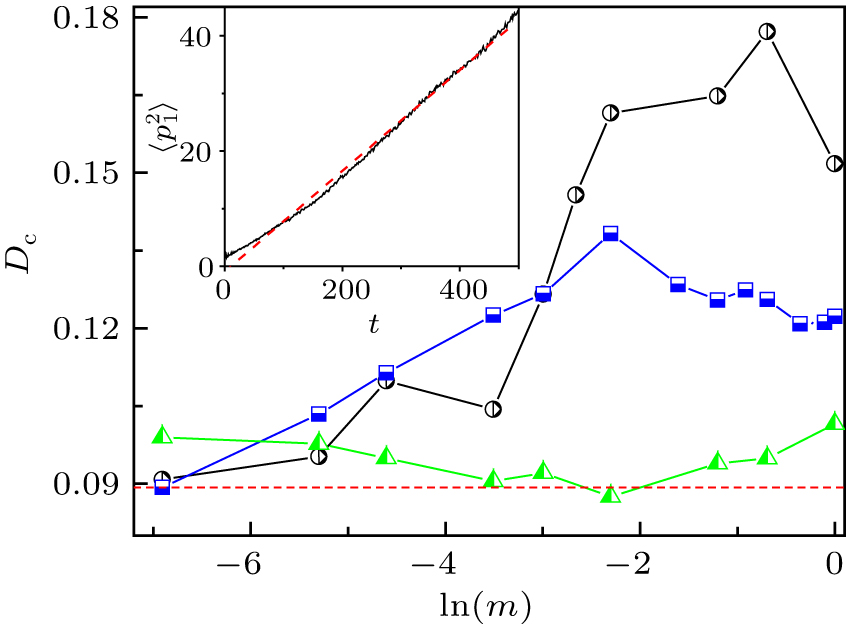
    Fig. 1. Classical diffusion coefficient Dc of particle 1 versus m for ε = 0.1 (triangles), 2 (squares), and 4 (circles). The dashed line (in red) denotes the classical diffusion coefficient of unperturbed case, i.e., ε = 0. Inset: mean square of classical momentum of particle 1 versus time for m = 0.001. Dashed line (in red) denotes the fitting function of the form p12(t)=Dct with Dc = 0.087. The parameters are K1 = 1.8, K2 = 0, λ = 10, and L = π.
    (a) Time dependence of the classical (red line) mean energy and quantum mean energy (black lines) of particle 1. From top to bottom, black solid lines correspond to ℏeff = 0.01, 0.02, 0.03, 0.04, and 0.05, respectively. The parameters are K1 = 1.8, K2 = 0, m = 0.001, ε = 2, λ = 10, and L = π. For comparison, the dashed line (in blue) denotes the quantum mean energy of the unperturbed case, i.e., ε = 0 with K = 1.8 and ℏeff = 0.01. (b) Momentum distribution at the time t = 500 with ℏeff = 0.01 (blue curve) and 0.05 (black curve). Dash-dotted line (in red) indicates the fitting function of the Gaussian form |ψ1(p)|2∝ e−p2/ζ. Dashed line (in red) denotes the exponential fitting |ψ1(p)|2∝ e−|p|/ξ.
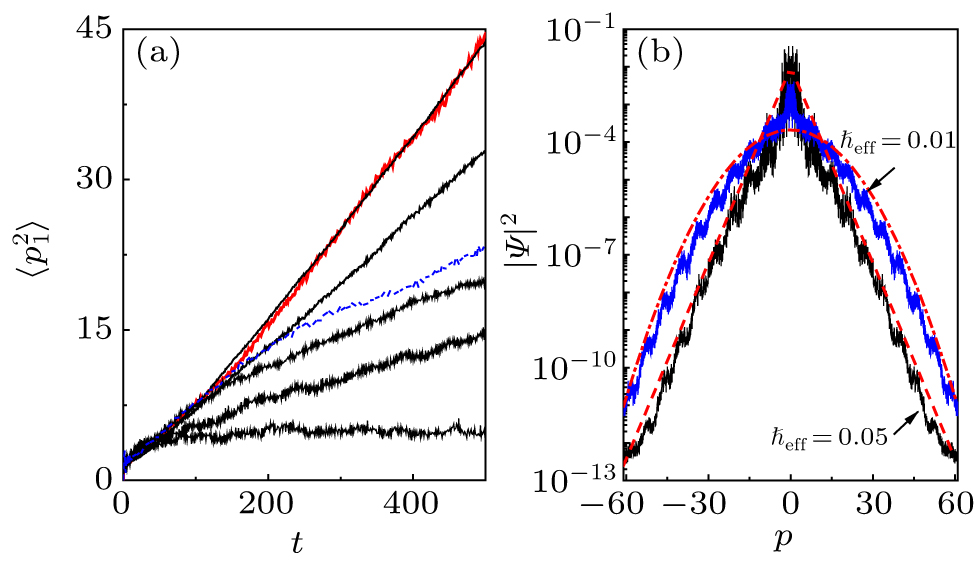
    Fig. 2. (a) Time dependence of the classical (red line) mean energy and quantum mean energy (black lines) of particle 1. From top to bottom, black solid lines correspond to eff = 0.01, 0.02, 0.03, 0.04, and 0.05, respectively. The parameters are K1 = 1.8, K2 = 0, m = 0.001, ε = 2, λ = 10, and L = π. For comparison, the dashed line (in blue) denotes the quantum mean energy of the unperturbed case, i.e., ε = 0 with K = 1.8 and eff = 0.01. (b) Momentum distribution at the time t = 500 with eff = 0.01 (blue curve) and 0.05 (black curve). Dash-dotted line (in red) indicates the fitting function of the Gaussian form |ψ1(p)|2∝ e−p2/ζ. Dashed line (in red) denotes the exponential fitting |ψ1(p)|2∝ e−|p|/ξ.
    (a), (b) Time dependence of the mean energy. In (a), ℏeff = 0.01, from top to bottom solid lines correspond to δKmax=0.012, 0.008, 0.005, and 0. In (b), δKmax=0.012, from top to bottom solid lines correspond to ℏeff = 0.01, 0.02, 0.03, and 0.05. For comparison, red-dashed lines denote the classical mean energy with δKmax=0. (c) Momentum distribution at the time t = 500 with δKmax=0.012 for ℏeff = 0.01 and 0.05, respectively. The parameters are K = 1.8 and L = π. Black curves denote the momentum distributions for the two-particle systems with m = 0.001, K1 = 1.8, ε = 2, λ = 10, and L = π (same as in Fig. 1(b)).
    Fig. 3. (a), (b) Time dependence of the mean energy. In (a), eff = 0.01, from top to bottom solid lines correspond to δKmax=0.012, 0.008, 0.005, and 0. In (b), δKmax=0.012, from top to bottom solid lines correspond to eff = 0.01, 0.02, 0.03, and 0.05. For comparison, red-dashed lines denote the classical mean energy with δKmax=0. (c) Momentum distribution at the time t = 500 with δKmax=0.012 for eff = 0.01 and 0.05, respectively. The parameters are K = 1.8 and L = π. Black curves denote the momentum distributions for the two-particle systems with m = 0.001, K1 = 1.8, ε = 2, λ = 10, and L = π (same as in Fig. 1(b)).
    (a) The ratio ℛ versus ℏeff with m = 0.001 (triangles), 0.01 (circles), and 1 (squares). Dashed lines (in red) denote the exponential fitting, i.e., ℛ ∝ e−αℏeff. (b) Phase diagram of quantum diffusion as a function of ℏeff and m, where circles and triangles indicate the threshold values of ℏeffc and ℏeffd which correspond to the appearance of classically chaotic diffusion and dynamical localization, respectively. The coupling strength is ε = 2. Other parameters are the same as those in Fig. 2.
    Fig. 4. (a) The ratio versus eff with m = 0.001 (triangles), 0.01 (circles), and 1 (squares). Dashed lines (in red) denote the exponential fitting, i.e., ∝ eαℏeff. (b) Phase diagram of quantum diffusion as a function of eff and m, where circles and triangles indicate the threshold values of effc and effd which correspond to the appearance of classically chaotic diffusion and dynamical localization, respectively. The coupling strength is ε = 2. Other parameters are the same as those in Fig. 2.
    Purity P versus time with K2 = 0 (circles), 0.03 (triangles), 0.05 (diamonds), 0.09 (pentagrams), and 0.12 (squares). Dashed lines (in blue) denote the fitting function of the form P∝t−η. Dashed-dotted (in red) line indicates the exponential fitting P∝exp(−γt). The parameters are K1 = 5, m = 0.01, ℏ = 10−4, ε = 20ℏ, λ = 10, and L = π.
    Fig. 5. Purity P versus time with K2 = 0 (circles), 0.03 (triangles), 0.05 (diamonds), 0.09 (pentagrams), and 0.12 (squares). Dashed lines (in blue) denote the fitting function of the form Ptη. Dashed-dotted (in red) line indicates the exponential fitting Pexp(γt). The parameters are K1 = 5, m = 0.01, = 10−4, ε = 20, λ = 10, and L = π.
    Wen-Lei Zhao, Quanlin Jie. Quantum to classical transition induced by a classically small influence[J]. Chinese Physics B, 2020, 29(8):
    Download Citation