• Journal of Geo-information Science
  • Vol. 22, Issue 5, 1142 (2020)
Lingli ZHU1、1、2、2, Hongyan REN1、1、*, Feng DING2、2, Liang LU3、3, Sijia WU1、1、2、2, and Cheng CUI1、1、4、4
Author Affiliations
  • 1.中国科学院地理科学与资源研究所 资源与环境信息系统国家重点实验室,北京 100101
  • 1State Key Laboratory of Resources and Environmental Information System, Institute of Geographic Sciences and Natural Resources Research, Chinese Academy of Sciences, Beijing 100101, China
  • 2.福建师范大学地理科学学院, 福州 350007
  • 2College of Geographical Sciences, Fujian Normal University, Fuzhou 350007, China
  • 3.中国疾病预防控制中心传染病预防控制所 媒介生物控制室传染病预防控制国家重点实验室,北京 102206
  • 3State Key Laboratory for Infectious Disease Prevention and Control, Department of Vector Biology and Control, National Institute for Communicable Disease Control and Prevention, Chinese Center for Disease Control and Prevention, Beijing 102206, China
  • 4.中国科学院大学资源与环境学院,北京 100190
  • 4College of Resources and Environment, University of Academy of Sciences, Beijing 100190 , China
  • show less
    DOI: 10.12082/dqxxkx.2020.190420 Cite this Article
    Lingli ZHU, Hongyan REN, Feng DING, Liang LU, Sijia WU, Cheng CUI. Spatiotemporal Variations and Influencing Factors of Hemorrhagic Fever with Renal Syndrome in Shaanxi Province[J]. Journal of Geo-information Science, 2020, 22(5): 1142 Copy Citation Text show less
    Administrative division map of Shaanxi Province
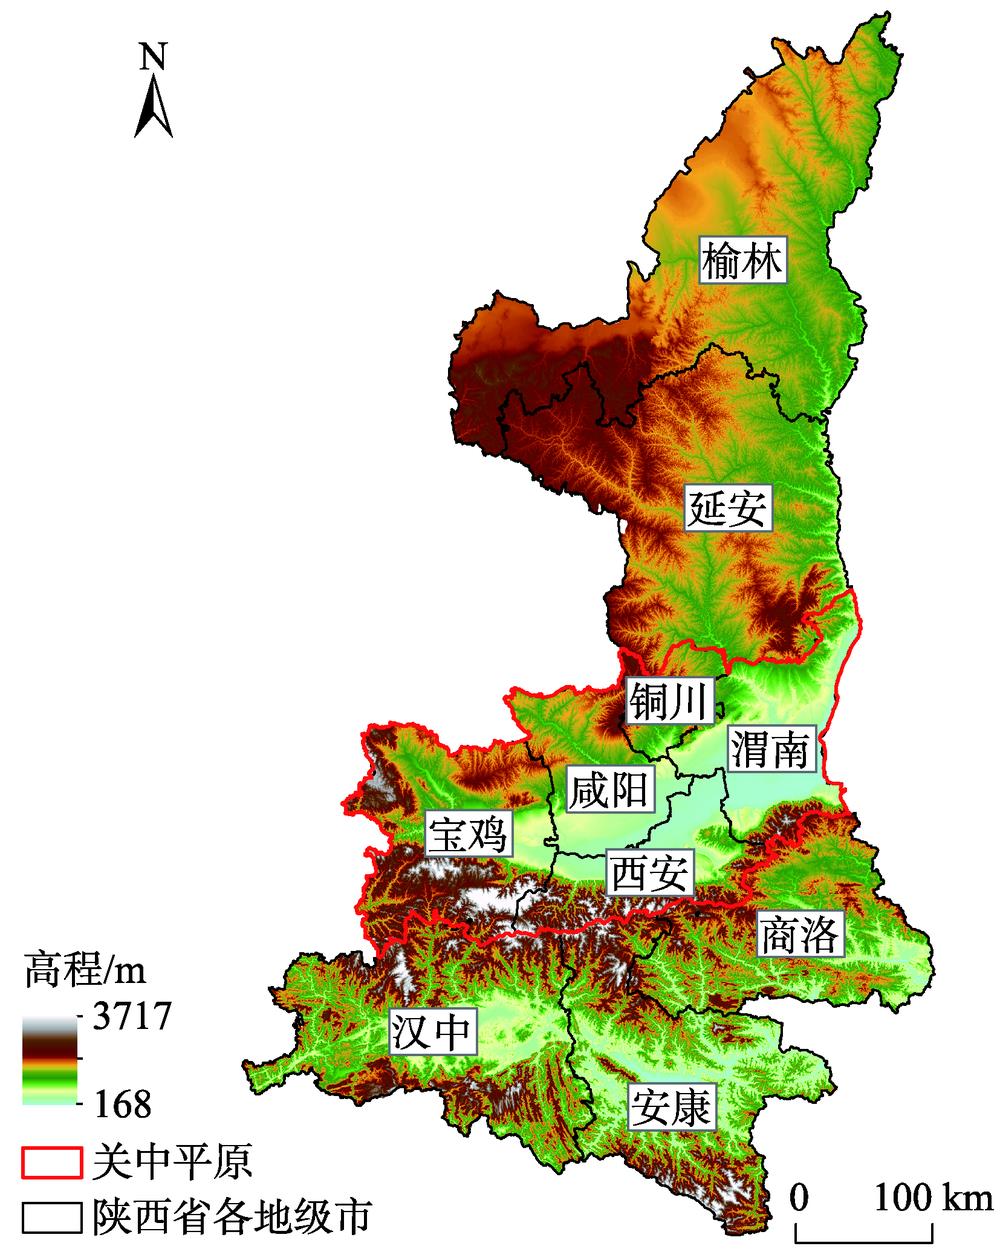
    Fig. 1. Administrative division map of Shaanxi Province
    The HFRS incidence rates in Shaanxi Province and China and the number of counties with 10% higher than the annual incidence in Shaanxi Province from 2005 to 2017
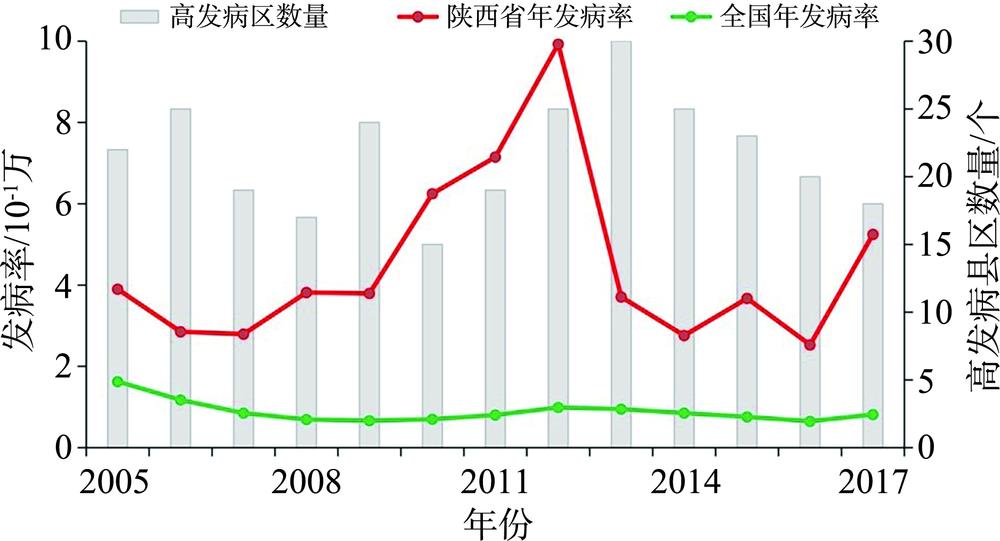
    Fig. 2. The HFRS incidence rates in Shaanxi Province and China and the number of counties with 10% higher than the annual incidence in Shaanxi Province from 2005 to 2017
    Yearly distribution of HFRS incidence rates in Shaanxi Province and Global Moran's I from 2005 to 2017
    Fig. 3. Yearly distribution of HFRS incidence rates in Shaanxi Province and Global Moran's I from 2005 to 2017
    Yearly distribution of HFRS incidence rates hotspots in Shaanxi Province, from 2005 to 2017
    Fig. 4. Yearly distribution of HFRS incidence rates hotspots in Shaanxi Province, from 2005 to 2017
    The q value of environmental factors affecting distribution of HFRS incidences in Shaanxi Province
    Fig. 5. The q value of environmental factors affecting distribution of HFRS incidences in Shaanxi Province
    The q value of environmental factors affecting distribution of HFRS incidences in Guanzhong Plain
    Fig. 6. The q value of environmental factors affecting distribution of HFRS incidences in Guanzhong Plain
    要素数据变量时间数据源
    气象要素温度年均温度2005—2017中国气象数据网data.cma.cn
    降水量年均降水量2005—2017
    景观要素NDVI年度NDVI2005—2017中国科学院资源环境科学数据中心资源环境数据云平台www.resdc.cn
    地形因子DEM、坡度、坡向、地形起伏度
    地貌类型平原、台地、丘陵、山地
    土壤质地砂土、粉砂土、黏土
    社会经济要素土地利用类型耕地、林地、水域、建设用地2005、2010、2015
    GDP公里格网GDP2005、2010、2015
    人口密度公里格网人口密度2005、2010、2015
    Table 1. List of variables used in the HFRS incidence analysis
    年份交互作用1q交互作用2q交互作用3q
    2005平原∩坡向0.727平原∩粉砂土0.710林地∩人口密度0.652
    2006林地∩人口密度0.624水域∩人口密度0.583台地∩人口密度0.578
    2007林地∩人口密度0.610平原∩林地0.602平原∩坡度0.598
    2008平原∩降水量0.603平原∩地形起伏度0.570平原∩林地0.567
    2009平原∩地形起伏度0.693平原∩林地0.688平原∩坡度0.654
    2010平原∩地形起伏度0.797平原∩林地0.790平原∩坡度0.763
    2011平原∩坡度0.786平原∩地形起伏度0.756平原∩林地0.738
    2012平原∩NDVI0.531NDVI∩砂土0.505平原∩降水量0.490
    2013台地∩黏土0.564平原∩温度0.547降水量∩丘陵0.544
    2014平原∩降水量0.662平原∩坡度0.659平原∩温度0.620
    2015平原∩坡度0.671NDVI∩建设用地0.657平原∩温度0.653
    2016平原∩温度0.730平原∩坡度0.712林地∩建设用地0.710
    2017耕地∩建设用地0.613平原∩坡度0.603地形起伏度∩建设用地0.592
    Table 2. The dominant interactions between different environmental factors in Shaanxi Province
    年份交互作用1q交互作用2q交互作用3q
    2005降水量∩建设用地0.885林地∩人口密度0.826林地∩GDP0.818
    2006NDVI∩温度0.906温度∩建设用地0.855黏土∩建设用地0.839
    2007降水量∩建设用地0.837降水量∩人口密度0.820降水量∩黏土0.793
    2008降水量∩建设用地0.910温度∩降水量0.862温度∩水域0.857
    2009降水量∩建设用地0.874降水量∩人口密度0.869降水量∩耕地0.835
    2010林地∩人口密度0.850NDVI∩建设用地0.829降水量∩建设用地0.823
    2011降水量∩耕地0.877水域∩粉砂土0.804降水量∩黏土0.794
    2012降水量∩水域0.911降水量∩黏土0.839降水量∩耕地0.810
    2013NDVI∩水域0.754降水量∩水域0.700降水量∩未利用地0.694
    2014NDVI∩粉砂土0.788NDVI∩温度0.767降水量∩NDVI0.764
    2015降水量∩黏土0.872降水量∩建设用地0.841温度∩降水量0.822
    2016降水量∩砂土0.841降水量∩粉砂土0.841林地∩建设用地0.828
    2017林地∩人口密度0.808降水量∩耕地0.731NDVI∩砂土0.731
    Table 3. The dominant interactions between different environmental factors in Guanzhong Plain
    Lingli ZHU, Hongyan REN, Feng DING, Liang LU, Sijia WU, Cheng CUI. Spatiotemporal Variations and Influencing Factors of Hemorrhagic Fever with Renal Syndrome in Shaanxi Province[J]. Journal of Geo-information Science, 2020, 22(5): 1142
    Download Citation