• Photonics Research
  • Vol. 5, Issue 5, 516 (2017)
Xiaobei Zhang1、*, Yong Yang1, Huawen Bai1, Jiawei Wang1, Ming Yan1, Hai Xiao2, and Tingyun Wang1
Author Affiliations
  • 1Laboratory of Specialty Fiber Optics and Optical Access Networks, Shanghai Institute for Advanced Communication and Data Science, School of Communication and Information Engineering, Shanghai University, Shanghai 200072, China
  • 2Department of Electrical and Computer Engineering, Clemson University, Clemson, South Carolina 29634, USA
  • show less
    DOI: 10.1364/PRJ.5.000516 Cite this Article Set citation alerts
    Xiaobei Zhang, Yong Yang, Huawen Bai, Jiawei Wang, Ming Yan, Hai Xiao, Tingyun Wang. Theoretical aspects and sensing demonstrations of cone-shaped inwall capillary-based microsphere resonators[J]. Photonics Research, 2017, 5(5): 516 Copy Citation Text show less
    (a) Schematic of the cone-shaped inwall capillary-based microsphere resonator. (b) A typical Fano resonance and relevant parameter definitions.
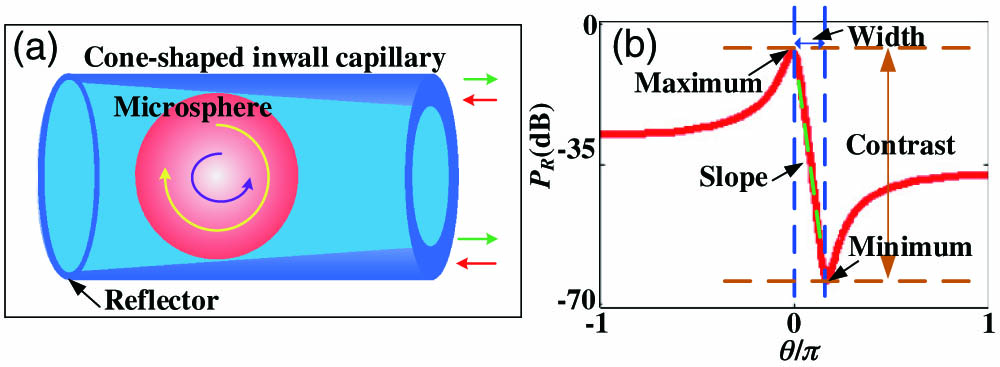
    Fig. 1. (a) Schematic of the cone-shaped inwall capillary-based microsphere resonator. (b) A typical Fano resonance and relevant parameter definitions.
    (a) Simulation of Fano resonances versus normalized frequency and δ (the reflection is normalized). (b)–(e) are the progression of PR as a function of δ in four quadrants of π/4 each.
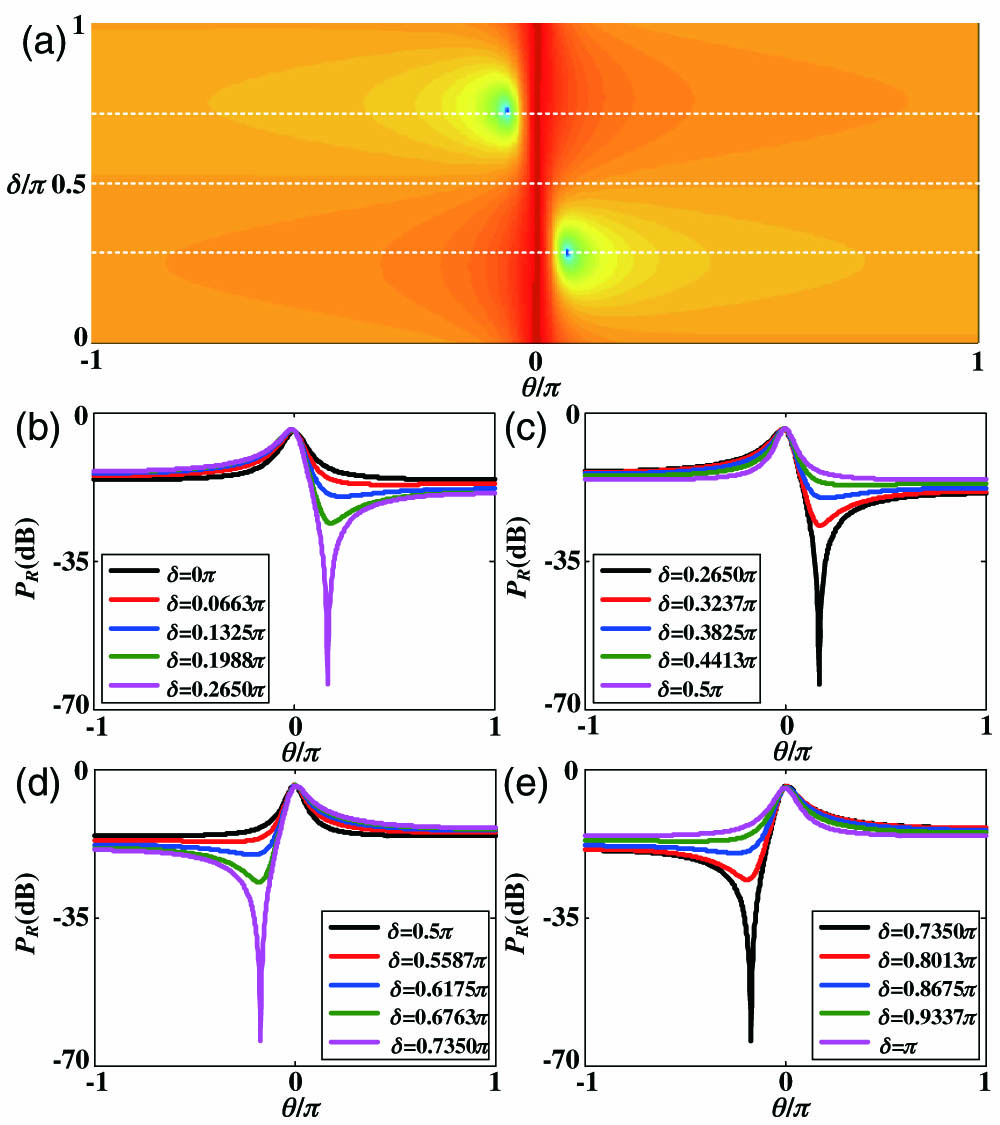
    Fig. 2. (a) Simulation of Fano resonances versus normalized frequency and δ (the reflection is normalized). (b)–(e) are the progression of PR as a function of δ in four quadrants of π/4 each.
    (a)–(c) Simulations when τ are 0.9, 0.95, and 0.99, respectively. (d) Illustration of the changing process of slope.
    Fig. 3. (a)–(c) Simulations when τ are 0.9, 0.95, and 0.99, respectively. (d) Illustration of the changing process of slope.
    Simulation of (a) the maximum and (b) the minimum versus t, when τ is 0.9, 0.95, and 0.99.
    Fig. 4. Simulation of (a) the maximum and (b) the minimum versus t, when τ is 0.9, 0.95, and 0.99.
    When τ is 0.9, 0.95, and 0.99, simulation of (a) Δθ/π and (b) contrast (dB).
    Fig. 5. When τ is 0.9, 0.95, and 0.99, simulation of (a) Δθ/π and (b) contrast (dB).
    (a)–(c) Simulations when δ adopted as 0, 0.5π, and 0.265π, respectively, with r increasing from 0 to 100%. (d) The slope and width of the Fano resonances with r increasing from 10% to 100%.
    Fig. 6. (a)–(c) Simulations when δ adopted as 0, 0.5π, and 0.265π, respectively, with r increasing from 0 to 100%. (d) The slope and width of the Fano resonances with r increasing from 10% to 100%.
    (a) Spectra, (b) peak wavelength shifts, and (c) width of a Fano resonance when temperature increases.
    Fig. 7. (a) Spectra, (b) peak wavelength shifts, and (c) width of a Fano resonance when temperature increases.
    (a) Spectra of the device in solutions with different refractive indices. (b) Intensity of the resonance peak at 1529 nm marked with a blue circle versus the refractive index.
    Fig. 8. (a) Spectra of the device in solutions with different refractive indices. (b) Intensity of the resonance peak at 1529 nm marked with a blue circle versus the refractive index.
    Xiaobei Zhang, Yong Yang, Huawen Bai, Jiawei Wang, Ming Yan, Hai Xiao, Tingyun Wang. Theoretical aspects and sensing demonstrations of cone-shaped inwall capillary-based microsphere resonators[J]. Photonics Research, 2017, 5(5): 516
    Download Citation