In this Letter, we discuss Raman–Nath acousto-optic diffraction, and a new model of Raman–Nath acousto-optic diffraction is presented. The model is based on the individual and simultaneous occurrences of phase-grating diffraction and the Doppler effect and optical phase modulation and photon–phonon scattering. We find that the optical phase modulation can cause temporal and spatial fluctuations of the diffracted light power escaping from the acoustic field.
Back in 1922, the scattering of light by an sound wave, known as Brillouin or acousto-optic scattering, was first predicted by Brillouin[1]. He also predicted that the scattered light had shifted in frequency. Brillouin scattering was first observed by Gross in liquids[2]. An acoustic signal produces regions of compression and rarefaction as it propagates through a medium. The induced strains change the refractive index of the medium. This provides a moving phase grating that may diffract an incident light beam into a single diffraction order, the Bragg diffraction, or multiple diffraction orders, the Raman–Nath diffraction (RNd)[1,3–7].
In 1967, Klein and Cook introduced the -parameter to distinguish between the two diffraction regimes[3]. It is well known that the acoustic actions in the RNd simultaneously cause the diffraction and phase shift and frequency shift of the incident light[1,2,8]. Conventionally, the RNd is analyzed independently by using a moving thin-phase grating diffraction model[1,3,5]. According to the model, the incident light is frequency shifted by the Doppler effect and is diffracted simultaneously by the grating. After the introduction of laser in the 1960s, the ideas of quantum mechanics were also employed to elucidate the RNd[1,5]. Since then, the RNd has also been regarded independently as the collision process of a photon and one or more phonons, which are known as photon–phonon scatterings. This collision process takes two forms: absorption and emission processes. During the absorption process, one or more phonons are annihilated by the incoming photon, and a higher-energy photon leaves the scattering site. In the emission process, one or more phonons are created by the incoming photon, and a lower-energy photon leaves the scattering site.
In the two models, the optical phase shift is ignored. Additionally, the acousto-optic interactions can in fact simultaneously cause the moving thin-phase grating diffraction and photon–phonon scattering, especially in an acousto-optic crystal[1,5,8]. Obviously, the conventional models are insufficient to describe the RNd. But, because of optical scatterings, the photon–phonon scattering model can still analyze the RNd in an optically scattering medium. Additionally, in case of ignoring the optical phase modulation, the grating diffraction model can still well explain the RNd in this kind of optically transparent media such as water, in which the photon–phonon scattering is very weak[9].
Sign up for Chinese Optics Letters TOC. Get the latest issue of Chinese Optics Letters delivered right to you!Sign up now
In this Letter, we present a new RNd model stemming from the simultaneous occurrences of phase-grating diffraction and the Doppler effect and optical phase modulation and photon–phonon scattering.
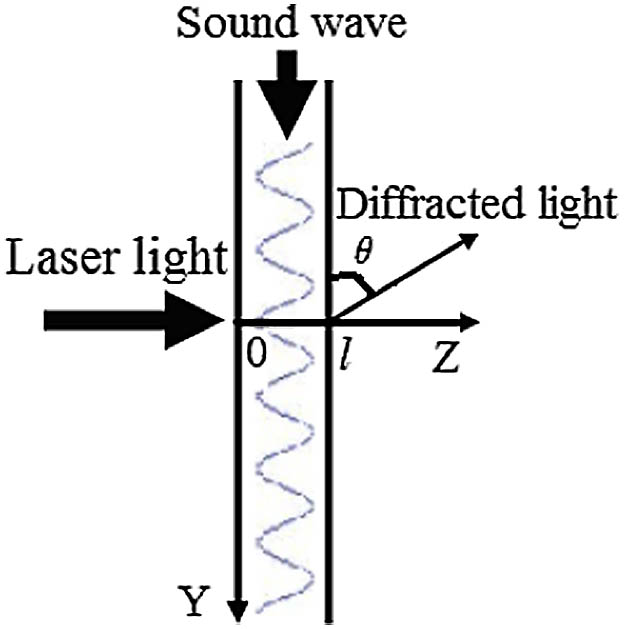
The RNd we will deal with is two dimensional. A typical configuration is seen in Fig. 1. An idealized sound beam is contained between planes and inside an optically transparent medium of refractive index . For a plane longitudinal sound wave with angular frequency and velocity in the medium, the refractive index at position and time obeys[1–3,5]where is the modulation constant of refractive index and depends on the acoustic power. From Eq. (1), the refractive index is modulated spatially and temporally by the sound wave.
In order to show the differences between the conventional and presented RNd models, we begin by introducing the moving thin-phase grating diffraction model. Based on the grating diffraction model, the diffracted light is given by[1–3,5]where is the electric field of the incident light; , , and are the wave vector, angular frequency, and wavelength of the incident light in the vacuum, respectively; is the diffraction angle; is the acoustic wavelength in the medium; is the diffraction order; denotes the th order Bessel function; is an impulse function. Here, due to the acoustic frequency being far less than the optical frequency, the optical phase shift caused by the optical frequency shift is ignored.
Now, it is seen from Eq. (2) that any order of diffracted light is a plane light wave with the same frequency shift and diffraction angle, and that its optical phase is not modulated temporally and spatially by the sound wave. Additionally, the average intensity of th-order diffracted light is
Note that the average intensity of any order of diffracted light varies with and its minimum value must be equal to zero in the process of the change of the value[1–3,5]. At last, in order to show the relation between the diffracted light and its origin inside the acoustic field, we assume that only the light coming from a defined region inside the acoustic field is collected. The region is assumed to be a rectangle with sizes and along the - and -directions, respectively, of which the center is in the position . In this case, after collecting all orders of diffracted light, the collected light power will be
We note that, no matter how many orders of diffracted light are collected, the power is not related to its origin . We further note that, due to the lack of requirements for the defined region sizes, the optical diffraction and shape of the defined region do not affect the relations. Therefore, it is feasible to make assumptions about the defined region.
Then, a new RNd model is proposed. In the model, the acousto-optic interactions simultaneously produce the moving thin-phase grating diffraction and optical phase modulation and photon–phonon scattering. However, since the grating diffraction and photon–phonon scattering are independent of each other, we can assume for derivation that the grating diffraction occurs first, and then the photon–phonon scattering. First, by the grating diffraction, the diffracted light can be expressed by Eq. (2). Then, due to the photon–phonon scattering, any order of diffracted light can be scattered into some other diffraction orders and moreover be frequency shifted by the corresponding integer times of the acoustic frequency. Here, the diffraction order of the diffracted light only depends on the diffraction angle. In this case, the th-order diffracted light can be written as where is an integer, and is the probability of simultaneous interactions between one photon of the th-order diffracted light and phonons, and is defined as the effective transmission distance of light inside the acoustic field and is a function of . At last, because of the spatial and temporal modulations of the refractive index by the sound wave, the optical phase of diffracted light must be also modulated spatially and temporally. In this case, the th-order diffracted light coming from the position can be given by where is defined as the effective transmission distance of light inside the acoustic field and is a function of and .
Our main focus is on the characteristics of our presented RNd model. Due to and the thin-phase grating diffraction, the lower-order diffracted light can be approximated to travel along the -direction. For simplicity, we are only concerned with the lower-order diffracted light here. In this case, by integrating Eq. (6) from to and then averaging the square of the integral result over time, we obtain the average intensity of th-order diffracted light,
Note that the minimum value of the average intensity of th-order diffracted light is not zero. At last, by only collecting the th-order diffracted light escaping from the defined region, we obtain the collected light power, which is where is an integer. Additionally, we obtain and in which both and are constants.
From Eq. (8), both the temporal modulation of the optical phase and the optical frequency shift can cause the temporal fluctuations of the collected light power. Additionally, the spatial modulation of the optical phase can cause the collected light power to fluctuate spatially with its origin over a cycle of the acoustic wavelength in the medium. Then, since any order of diffracted light is composed of a variety of light waves with different frequency shifts, the power also fluctuates with its origin , even though multiple orders of diffracted light are collected simultaneously. At last, the optical diffraction and shape of the defined region do not affect the temporal and spatial fluctuations.
In summary, based on the grating diffraction model, the minimum value of the average intensity of any order of diffracted light must be equal to zero in the process of the change in value. Additionally, the diffracted light power escaping from the acoustic field is not related to its origin and does not fluctuate spatially. However, according to our presented model, the simultaneous occurrences of the moving thin-phase grating diffraction and photon–phonon scattering lead to the nonzero minimum value of the average intensity of any order of diffracted light. Additionally, the temporal and spatial modulations of the optical phase cause the temporal and spatial fluctuations of the diffracted light power.
We first experimentally confirm the temporal and spatial modulations of the optical phase by obtaining the temporal and spatial fluctuations of the collected light power. To observe the spatial fluctuations, the experiment is conducted in distilled water using an ultrasonic wave with a relative low frequency (long wavelength in the medium). The experimental setup is seen in Fig. 2. A function generator output is a sine electrical signal, which excites an unfocusing transducer into generating a continuous ultrasound with a 1.71 MHz frequency and an 8 mm diameter. The distances from the central axis of the ultrasound beam to the front and left surfaces of the tank are approximately 3.5 and 2.5 cm, respectively. The tank, which is along the , , and -axes, respectively, holds 270 mL of distilled water. A He–Ne laser (630 nm) with a 2.0 cm diameter is irradiated onto the tank along -direction. The optical signals are collected by a photo-multiplier tube (PMT) with a 4.0 mm incidence window in its diameter, from which the electrical signals are read by an oscilloscope after amplification by an amplifier. A pinhole with an aperture of 0.1 mm is used. The distances from the pinhole to the tank and the PMT are approximately 50.0 and 1.0 cm, respectively. The PMT and pinhole are fixed together and can be moved together in the -direction. An ultrasonic absorber is placed at the bottom of the tank.
Figure 2.Schematic diagram of the experimental setup. U: ultrasonic transducer and its driver; DO: digital oscilloscope; A: amplifier; P: photomultiplier; PH: pinhole; DW: distilled water; L: laser.
In the experiment, the value of is about 0.033, which confirms that the optical diffraction here is indeed RNd. Additionally, since the above theoretical analyses show that the optical diffraction and shape of the defined region do not affect the temporal and spatial fluctuations of the collected light power, here, the pinhole can be used, and its optical diffraction can be ignored. At last, since the ultrasonic wavelength is only 0.850 mm in the distilled water, both the ultrasonic wave (diameter 8 mm) and the laser light (diameter 2.0 cm) can be considered as plane waves.
The electrical signals exciting the transducer are also read by the oscilloscope and chosen as a reference; its effective power remains 1.0 W. Figure 3 shows the waveforms of the electrical and optical signals emanating from the oscilloscope. Obviously, the collected light power fluctuates temporally. While moving the pinhole and the PMT together in -direction, we observe that the electrical signal waveform remains still, and yet the optical signal waveform also moves. Moreover, both overlap periodically. For a period, the moving distance is about 0.850 mm. By our calculation, the ultrasonic velocity in the distilled water is about , which is identical to the actual value. Then, the pinhole aperture is increased to about 4 mm, and the experiment is repeated. At last, the pinhole is replaced by a rectangular hole, and then the experiment is repeated again. The dimensions of the rectangular hole are along the and -axes, respectively. In these experiments, we observe the periodic overlapping. The periodic overlapping confirms the spatial fluctuations of the collected light power. Consequently, the experimental results prove the temporal and spatial modulations of the optical phase. Additionally, the experiment in turn proves that the optical diffraction and shape of the defined region do not affect the fluctuations.
Figure 3.Waveforms from an oscilloscope. (a) Electrical signals exciting the ultrasonic transducer. (b) Optical signals from PMT.
The following experiments are employed to support the simultaneous occurrences of the grating diffraction and photon–phonon scattering by obtaining a nonzero minimum value of the average intensity of the zero-order diffracted light. The zero-order diffracted light travels along the -direction and therefore, only its average intensity is measured. The experiments are conducted in the media with strong (acousto-optic crystal) and weak (distilled water[9]) photon–phonon scattering.
First, one experiment is done in an acousto-optic crystal (TeO2) with strong photon–phonon scattering. The experimental setup is the same as before. The distilled water and the PMT and oscilloscope are replaced by a crystal and light sensor and computer, respectively. The amplifier is removed. A He–Ne laser with about a 2 mm diameter is irradiated perpendicularly onto the crystal, of which the dimensions are along the , , and -axes. The ultrasonic frequency is adjusted to 20.00 MHz. The pinhole aperture is increased to 4.0 mm. The distance from the crystal to the pinhole is about 4.50 m. For an electrical signal with an effective power of 2.0 W exciting the transducer, the distributions of the diffracted light in the pinhole position are showed in Fig. 4. An ultrasonic absorber is placed in the bottom of the crystal.
Figure 4.Distributions of the diffracted light in the acousto-optic crystal.
For the experiment, the value of is about 0.3, and therefore, the optical diffraction is here also RNd. The value of is changed by adjusting the effective power of the electrical signals exciting the transducer. According to Fig. 4, the different orders of diffracted light are separated, and therefore, only the zero-order diffracted light is collected by the pinhole. Since the response time of the light sensor is 1 ms, which is more than the ultrasonic wave cycle, the light sensor can here be used to measure the average light intensity. At last, since the ultrasonic wavelength is only 0.21 mm in the crystal, both the ultrasonic wave (diameter 8 mm) and laser light (diameter 2 mm) can be considered approximately as plane waves.
To change the effective power of the electrical signals exciting the transducer, the average intensity of the zero-order diffracted light is measured at the same time and are shown in Fig. 5. Obviously, the minimum value of the average intensity is not zero, and is about 31% of the average intensity without the presence of the sound wave. Consequently, the experimental results confirm the simultaneous occurrences of the grating diffraction and photon–phonon scattering.
Figure 5.Normalized average intensity of zero-order diffracted light versus the effective power of the electrical signals applied to the ultrasonic transducer in an acousto-optic crystal.
Then, the other experiment is done in distilled water. The experimental setup is the same as the one in the first experiment. The PMT and oscilloscope are replaced by a light sensor and computer, respectively. The amplifier is removed. The ultrasonic frequency is adjusted to 3.70 MHz. A rectangular hole, of which the dimensions are along the and -axes, respectively, is used so that only the light coming from the ultrasonic field is collected. A convex lens with an aperture of 25 mm and a focal length of 550 mm is also used. The rectangular hole and convex lens are sequentially placed between the tank and light sensor. The distance between the rectangular hole and tank is approximately 30 mm. The distances from the lens optical center to the rectangular hole and pinhole are approximately 50 and 550 mm, respectively. The light sensor and pinhole are fixed together and can be moved together in -direction. The centers of the rectangular hole and pinhole and convex lens are on a straight line, which is parallel to the -axis.
In this experiment, the value of is about 0.16, and therefore, the optical diffraction is also RNd. First, the pinhole aperture is decreased to about 0.05 mm and the effective power of the electrical signal exciting the transducer remains at about 0.2 W. Next, by moving the pinhole and light sensor together in -direction, the diffracted light intensity distributions in the lens focal plane are recorded and shown in Fig. 6. From Fig. 6, it can be seen that the different orders of diffracted light are separated by the convex lens. Then, the pinhole aperture is increased to 0.2 mm, and only the zero-order diffracted light is collected by the pinhole. At last, to change the effective power of the electrical signal exciting the transducer, the average intensity of the zero-order diffracted light is measured at the same time. The experimental results are shown in Fig. 7. Obviously, the minimum value is not zero, but it is very small. Consequently, the experimental results also confirm the simultaneous occurrences of the phase-grating diffraction and photon–phonon scattering. Additionally, in case of ignoring the optical phase modulation, the grating diffraction model can also well explain the RNd in this kind of optically transparent media such as distilled water, in which the photon–phonon scattering is very weak.
Figure 6.Distributions of diffracted light in distilled water.
Figure 7.Normalized average intensity of zero-order diffracted light versus the effective power of the electrical signal applied to the ultrasonic transducer in distilled water.
In conclusion, we present a new RNd model. In the model, the grating diffraction and the Doppler effect and optical phase modulation and photon–phonon scattering occur individually and simultaneously. We find that the optical phase modulation can cause the temporal and spatial fluctuations of the diffracted light power escaping from the acoustic field.
References
[1] R. W. Boyd. Diffraction, Nonlinear Optics(2008).