
Jiahui Kang, Haiyang Gao, Shujun Liao, Leilei Kou, Piman Ding, Zhen Wang, Lingbing Bu. Simulation of Spaceborne Wind Lidar Based on Fizeau Interferometer[J]. Chinese Journal of Lasers, 2023, 50(23): 2310002
- Chinese Journal of Lasers
- Vol. 50, Issue 23, 2310002 (2023)
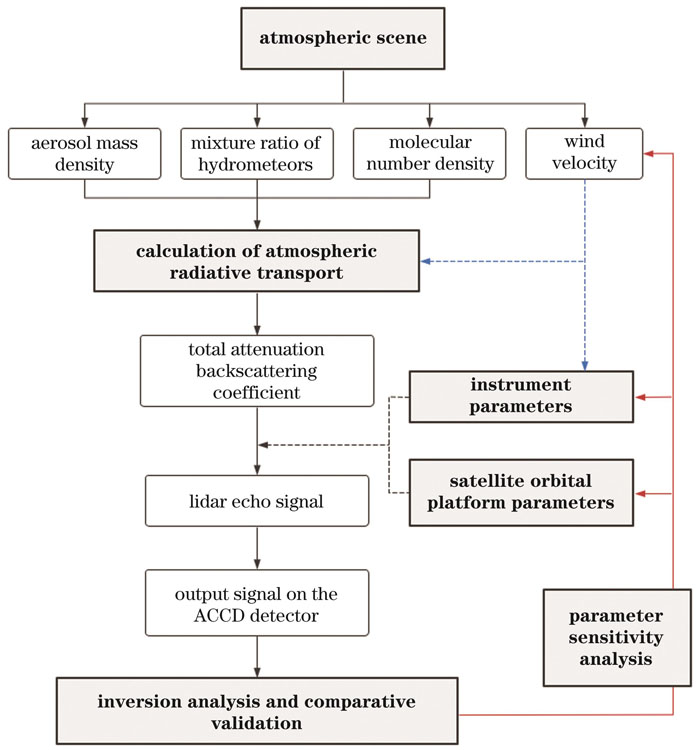
Fig. 1. Sub-module structure and logic framework of forward model
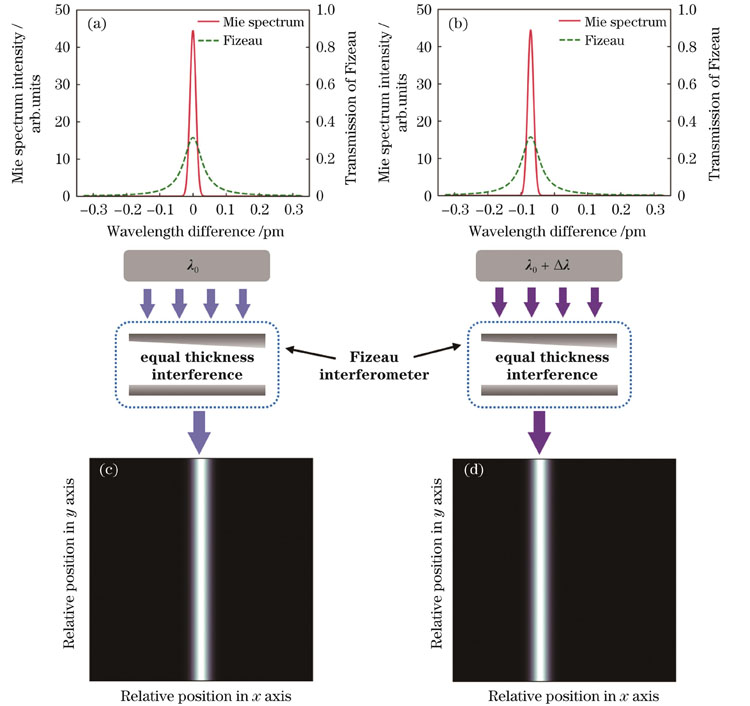
Fig. 2. Schematic diagram of wind speed detection by Fizeau interferometer of Mie channel. (a),(b) Mie scattering echo spectra and transmission curves of Fizeau interferometer for different central wavelengths; (c),(d) corresponding output images from detector
Fig. 3. Schematic diagram of ACCD detection principle and signal on ACCD. (a) Schematic diagram of ACCD detection principle; (b) normalized transmissivity curve on ACCD; (c),(d) relative strength of signal received on ACCD at radial wind speed of 0 (c) and 35 m/s (d)
Fig. 4. Systematic errors of three methods for retrieving radial wind speed. (a) Centroid method; (b) maximum likelihood function; (c), (d) Gaussian correlation algorithm
Fig. 5. Typical scene. (a) Spatial distribution of total aerosol mass concentration and cloud ice mixing ratio; (b) total mass concentration of aerosol; (c) cloud ice mixing ratio; (d) attenuation backscattering coefficient; (e) radial wind speed
Fig. 6. Simulation results of three typical profiles marked in Fig. 5(d). (a) 34.95°N; (b) 35.65°N; (c) 36.36°N. (a1),(b1),(c1) Simulation results of ACCD detector signal; (a2),(b2),(c2) normalized results of ACCD detector signal; (a3),(b3),(c3) attenuation backscattering coefficients; (a4),(b4),(c4) input scene wind speed and output simulated wind speed; (a5),(b5),(c5) wind speed error; (a6), (b6), (c6) signal-to-noise ratio
Fig. 7. Two-dimensional diagram of wind speed simulation results.(a)‒(c) Output simulated wind speed, signal-to-noise ratio, and wind speed error with horizontal resolution of 1 km; (d)‒(f) output simulated wind speed, signal-to-noise ratio, and wind speed error with horizontal resolution of 5 km
Fig. 8. Comparison of wind speed profiles with horizontal resolution of 1 km and 5 km. (a) Wind speed; (b) wind speed error; (c) relative error
Fig. 9. Influence of satellite orbit altitude and laser pulse energy on signal-to-noise ratio and wind speed error. (a),(b) Influence of satellite orbit altitude on signal-to-noise ratio and wind speed error; (c),(d) influence of laser pulse energy on signal-to-noise ratio and wind speed error
Fig. 10. Influence of ACCD detector’s channel number on accuracy of wind speed inversion by centroid method. (a),(b) Number of ACCD detector channels is 16; (c),(d) number of ACCD detector channels is 64
|
Table 1. Input parameters for forward model of spaceborne wind lidar

Set citation alerts for the article
Please enter your email address
© Copyright 2018-2021 | Chinese Laser Press. All Rights Reserved 沪ICP备15018463号-20