• Chinese Optics Letters
  • Vol. 17, Issue 7, 070201 (2019)
Aopeng Xu1, Delong Kong1, Zhijie Fu1, Zhaoying Wang1、*, and Qiang Lin2、**
Author Affiliations
  • 1Institute of Optics, Department of Physics, Zhejiang University, Hangzhou 310027, China
  • 2Center for Optics and Optoelectronics Research, College of Science, Zhejiang University of Technology, Hangzhou 310014, China
  • show less
    DOI: 10.3788/COL201917.070201 Cite this Article Set citation alerts
    Aopeng Xu, Delong Kong, Zhijie Fu, Zhaoying Wang, Qiang Lin. Vibration compensation of an atom gravimeter[J]. Chinese Optics Letters, 2019, 17(7): 070201 Copy Citation Text show less
    Schematic diagram of our atom gravimeter.
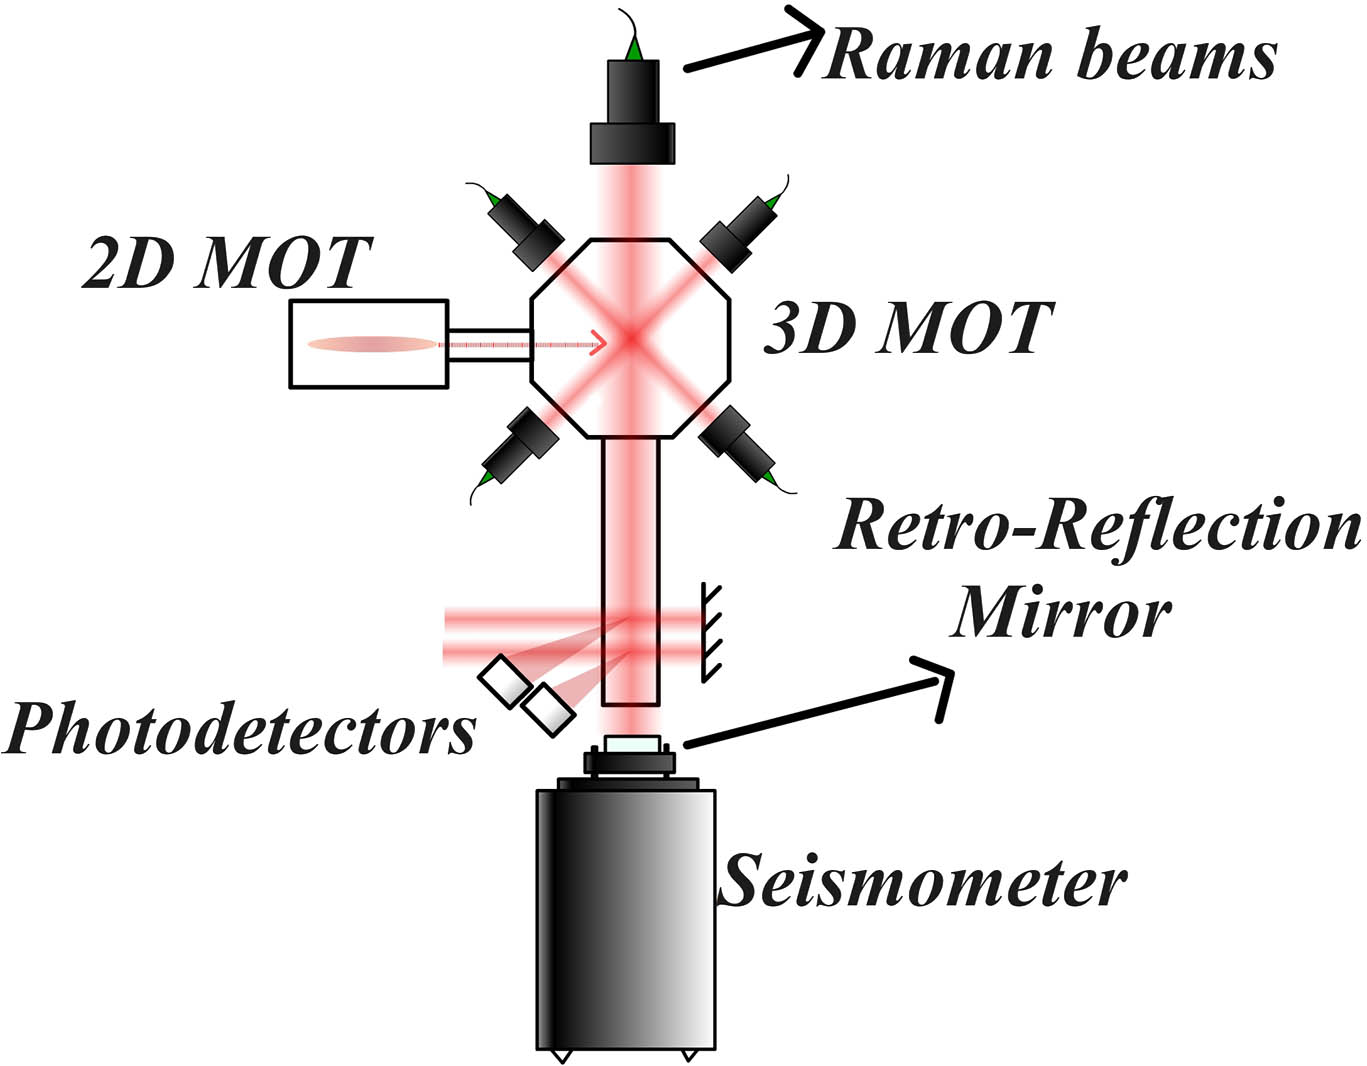
    Fig. 1. Schematic diagram of our atom gravimeter.
    Below 500 Hz, the weighting function for the vibration phase noise as a function of frequency.
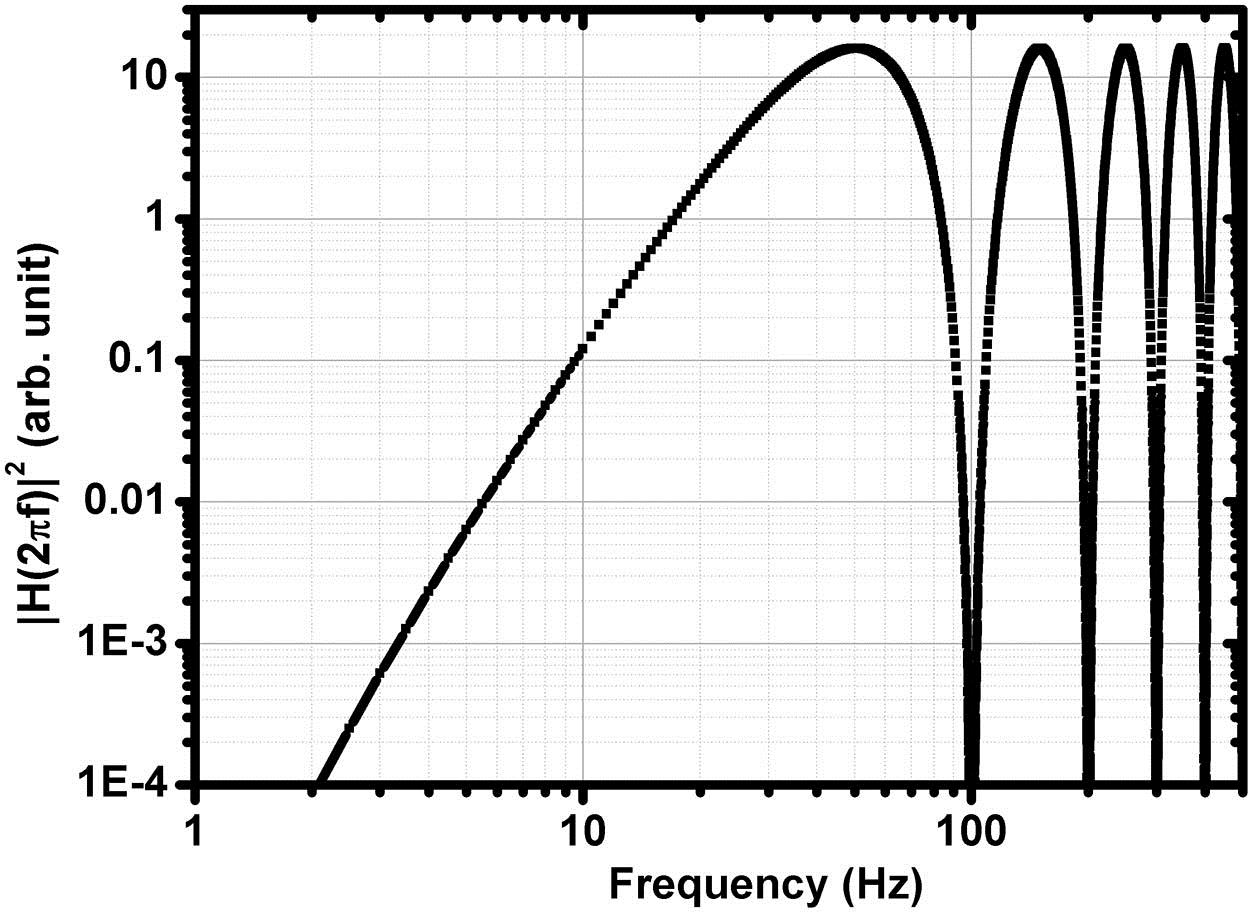
    Fig. 2. Below 500 Hz, the weighting function for the vibration phase noise as a function of frequency.
    50 Hz vibration signal collected by the seismometer.
    Fig. 3. 50 Hz vibration signal collected by the seismometer.
    Influence of different frequency vibrations on the atom interferometer.
    Fig. 4. Influence of different frequency vibrations on the atom interferometer.
    After calibration of the transfer functions A(50 Hz) and φ(50 Hz), a sinusoidal curve is obtained. The black dot is the relationship between transfer probability and vibration correction phase; we use the seismometer to record the vibration and calculate the correction phase, and the transfer probability is measured by the atom interferometer. The red line is the sine fit.
    Fig. 5. After calibration of the transfer functions A(50Hz) and φ(50Hz), a sinusoidal curve is obtained. The black dot is the relationship between transfer probability and vibration correction phase; we use the seismometer to record the vibration and calculate the correction phase, and the transfer probability is measured by the atom interferometer. The red line is the sine fit.
    Interference fringes in different vibration compensations. (a) The original fringe without vibration compensation while the vibration frequency is 50 Hz. (b) The fringe after vibration compensation while the vibration frequency is 50 Hz, A(50 Hz)=−1.299 dB, and φ(50 Hz)=−64 deg. (c) The original fringe without vibration compensation while the vibration frequency is 80 Hz. (d) The fringe after vibration compensation while the vibration frequency is 80 Hz, A(80 Hz)=−1.299 dB, and φ(80 Hz)=−64 deg. (e) The fringe after vibration compensation while the vibration frequency is 80 Hz, A(80 Hz)=−4.895 dB, and φ(80 Hz)=−143.2 deg.
    Fig. 6. Interference fringes in different vibration compensations. (a) The original fringe without vibration compensation while the vibration frequency is 50 Hz. (b) The fringe after vibration compensation while the vibration frequency is 50 Hz, A(50Hz)=1.299dB, and φ(50Hz)=64deg. (c) The original fringe without vibration compensation while the vibration frequency is 80 Hz. (d) The fringe after vibration compensation while the vibration frequency is 80 Hz, A(80Hz)=1.299dB, and φ(80Hz)=64deg. (e) The fringe after vibration compensation while the vibration frequency is 80 Hz, A(80Hz)=4.895dB, and φ(80Hz)=143.2deg.
    Atom interference fringe can be optimized by using vibration compensation.
    Fig. 7. Atom interference fringe can be optimized by using vibration compensation.
    Atom interference fringe in an extremely noisy environment. The black dot is the data before vibration compensation, the green dot is the data after vibration compensation, and the red line is the sine fit of the green dot.
    Fig. 8. Atom interference fringe in an extremely noisy environment. The black dot is the data before vibration compensation, the green dot is the data after vibration compensation, and the red line is the sine fit of the green dot.
    Allan standard deviation of three different situations.
    Fig. 9. Allan standard deviation of three different situations.
    Gravity measurement versus the different vibration amplitudes.
    Fig. 10. Gravity measurement versus the different vibration amplitudes.
    Gravity measurement result at different vibration frequencies.
    Fig. 11. Gravity measurement result at different vibration frequencies.
    Aopeng Xu, Delong Kong, Zhijie Fu, Zhaoying Wang, Qiang Lin. Vibration compensation of an atom gravimeter[J]. Chinese Optics Letters, 2019, 17(7): 070201
    Download Citation