• Photonics Research
  • Vol. 7, Issue 1, 61 (2019)
Tianyu Zhu1, Zhaokun Wang1、2, D. N. Wang1、*, Fan Yang1, and Liujiang Li1
Author Affiliations
  • 1College of Optical and Electronic Technology, China Jiliang University, Hangzhou 310018, China
  • 2e-mail: 16a0402091@cjlu.edu.cn
  • show less
    DOI: 10.1364/PRJ.7.000061 Cite this Article Set citation alerts
    Tianyu Zhu, Zhaokun Wang, D. N. Wang, Fan Yang, Liujiang Li. Observation of controllable tightly and loosely bound solitons with an all-fiber saturable absorber[J]. Photonics Research, 2019, 7(1): 61 Copy Citation Text show less
    (a) Schematic diagram of the experimental setup. Red arrow represents the direction of laser transmission, and the small diagram shows the SA structure; (b) transmission spectrum of the NCF-GIMF device; (c) nonlinear saturable absorption curve of the NCF-GIMF device.
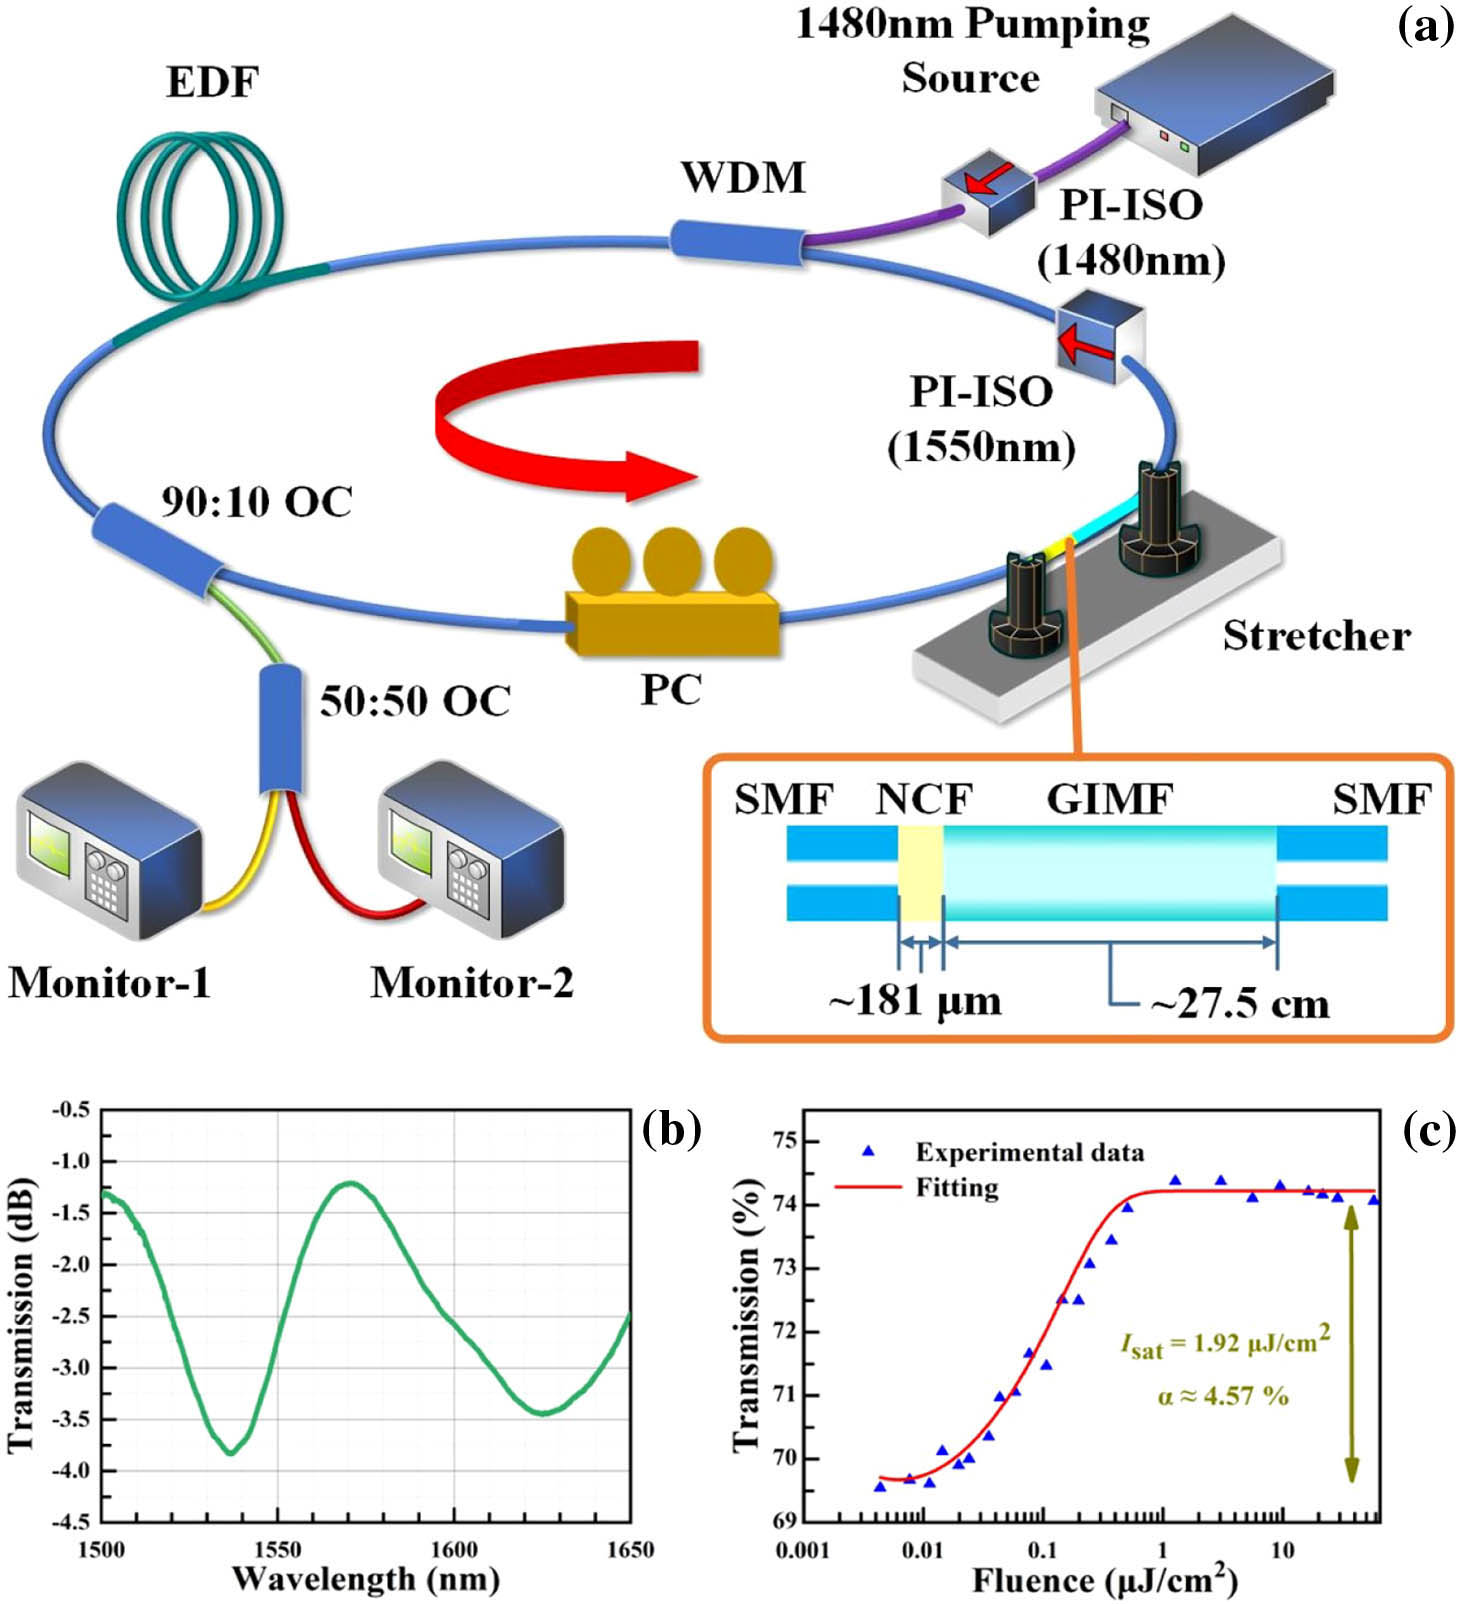
    Fig. 1. (a) Schematic diagram of the experimental setup. Red arrow represents the direction of laser transmission, and the small diagram shows the SA structure; (b) transmission spectrum of the NCF-GIMF device; (c) nonlinear saturable absorption curve of the NCF-GIMF device.
    Conventional mode-locked single soliton outputs. (a) Optical spectrum; (b) autocorrelation trace; (c) pulse train; (d) RF spectrum.
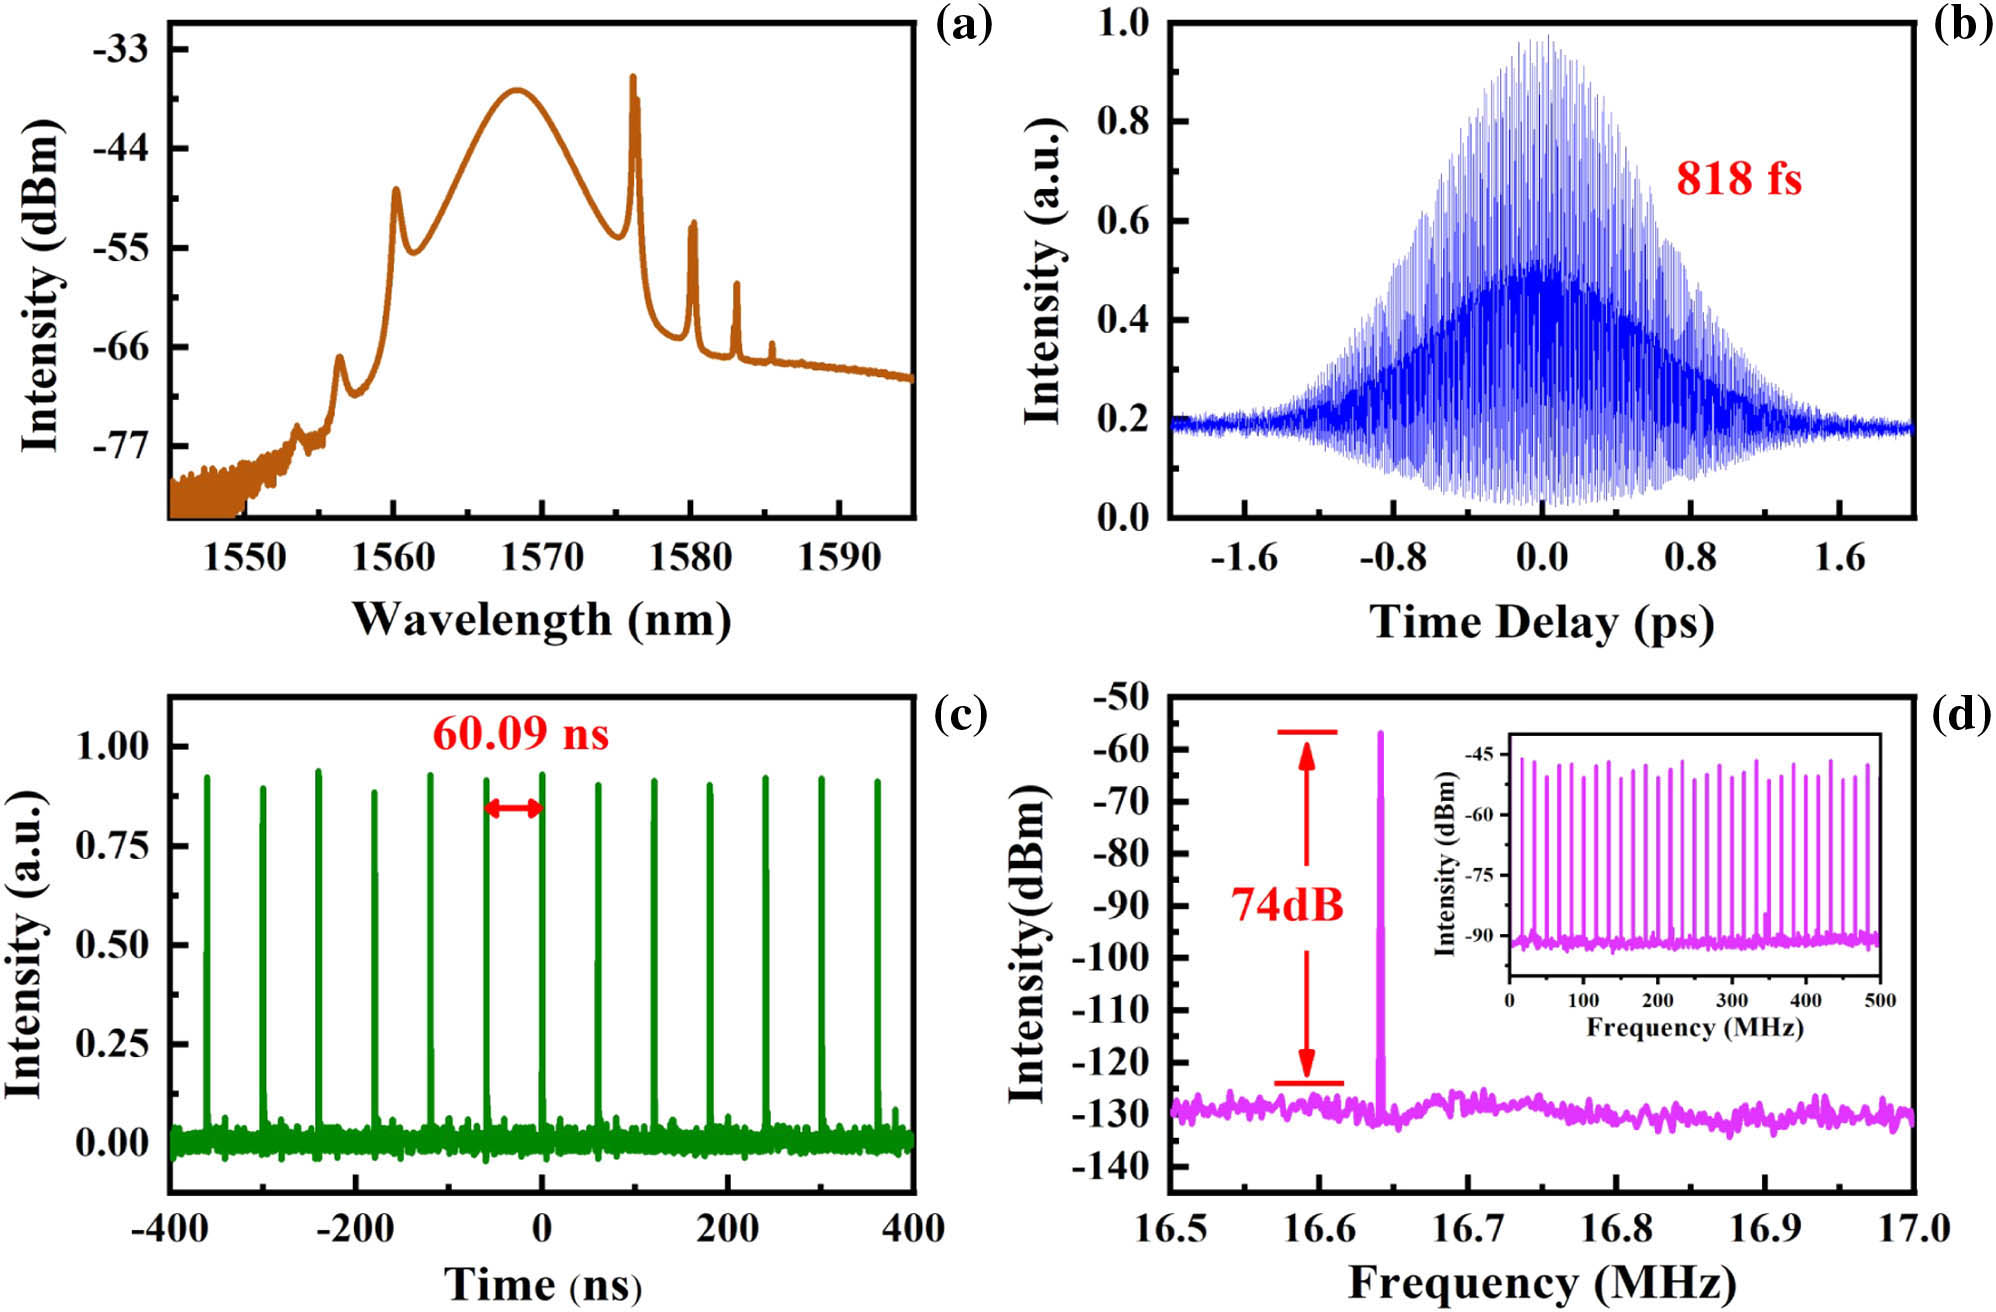
    Fig. 2. Conventional mode-locked single soliton outputs. (a) Optical spectrum; (b) autocorrelation trace; (c) pulse train; (d) RF spectrum.
    Output of stable tight soliton pairs. (a) Optical spectrum; (b) autocorrelation trace; (c) pulse train; (d) RF spectrum.
    Fig. 3. Output of stable tight soliton pairs. (a) Optical spectrum; (b) autocorrelation trace; (c) pulse train; (d) RF spectrum.
    Tunable wavelength spectra in tight soliton pairs.
    Fig. 4. Tunable wavelength spectra in tight soliton pairs.
    Relationship between the stretched length of the SA and wavelength.
    Fig. 5. Relationship between the stretched length of the SA and wavelength.
    Autocorrelation traces with different spectral modulation periods. The profiles in red are optical spectra with details in enlarged scale in the corner. The profiles in blue are autocorrelation traces with pulse width in the corner, corresponding to the panels on the left.
    Fig. 6. Autocorrelation traces with different spectral modulation periods. The profiles in red are optical spectra with details in enlarged scale in the corner. The profiles in blue are autocorrelation traces with pulse width in the corner, corresponding to the panels on the left.
    (a)–(c) Different spectra of quasi-bound pairs; (d)–(f) corresponding autocorrelation traces.
    Fig. 7. (a)–(c) Different spectra of quasi-bound pairs; (d)–(f) corresponding autocorrelation traces.
    F. N.M. P.C. W.P. S.I. R.M. A.P. W.
    Figures 6(a) and 6(b)0.236 nm1568 nm37.57 ps1:1.84:114.51 dBm883 fs
    Figures 6(c) and 6(d)0.187 nm1569 nm45.63 ps1:1.83:114.15 dBm928 fs
    Figures 6(e) and 6(f)0.177 nm1569 nm46.14 ps1:1.82:112.22 dBm896 fs
    Figures 6(g) and 6(h)0.145 nm1570 nm56.46 ps1:1.78:19.29 dBm889 fs
    Table 1. Detailed Characteristics of Loosely Bound Solitons Corresponding to Fig. 6a
    Tianyu Zhu, Zhaokun Wang, D. N. Wang, Fan Yang, Liujiang Li. Observation of controllable tightly and loosely bound solitons with an all-fiber saturable absorber[J]. Photonics Research, 2019, 7(1): 61
    Download Citation