• Photonics Research
  • Vol. 8, Issue 3, 352 (2020)
Christian Lafforgue1、†,*, Sylvain Guerber1、2、†, Joan Manel Ramirez3, Guillaume Marcaud1, Carlos Alonso-Ramos1, Xavier Le Roux1, Delphine Marris-Morini1, Eric Cassan1, Charles Baudot2, Frédéric Boeuf2, Sébastien Cremer2, Stéphane Monfray2, and Laurent Vivien1
Author Affiliations
  • 1Centre for Nanoscience and Nanotechnology (C2N), CNRS, Université Paris-Sud, Université Paris-Saclay, UMR 9001, 91405 Orsay Cedex, France
  • 2Technologie R&D, STMicroelectronics, SAS, 850 rue Jean Monnet, 38920 Crolles, France
  • 3III-V lab, a joint venture from Nokia Bell Labs, Thales and CEA, 1 Avenue Augustin Fresnel, 91767 Palaiseau Cedex, France
  • show less
    DOI: 10.1364/PRJ.379555 Cite this Article Set citation alerts
    Christian Lafforgue, Sylvain Guerber, Joan Manel Ramirez, Guillaume Marcaud, Carlos Alonso-Ramos, Xavier Le Roux, Delphine Marris-Morini, Eric Cassan, Charles Baudot, Frédéric Boeuf, Sébastien Cremer, Stéphane Monfray, Laurent Vivien. Broadband supercontinuum generation in nitrogen-rich silicon nitride waveguides using a 300 mm industrial platform[J]. Photonics Research, 2020, 8(3): 352 Copy Citation Text show less
    (a) Schematic view of the waveguide section; (b) SEM view of spiral waveguide; (c) and (d) TE mode profile at 1200 nm wavelength for a 700 nm-wide waveguide and a 1200 nm-wide waveguide, respectively; (e) schematic view of the final design for the straight waveguide (top view).
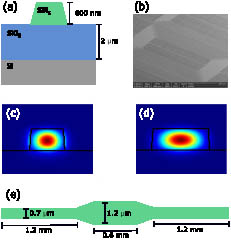
    Fig. 1. (a) Schematic view of the waveguide section; (b) SEM view of spiral waveguide; (c) and (d) TE mode profile at 1200 nm wavelength for a 700 nm-wide waveguide and a 1200 nm-wide waveguide, respectively; (e) schematic view of the final design for the straight waveguide (top view).
    (a) Refractive index of N-rich SiNx measured by ellipsometry compared to Si3N4; (b) calculated dispersion parameter in an N-rich SiNx waveguide for different widths.
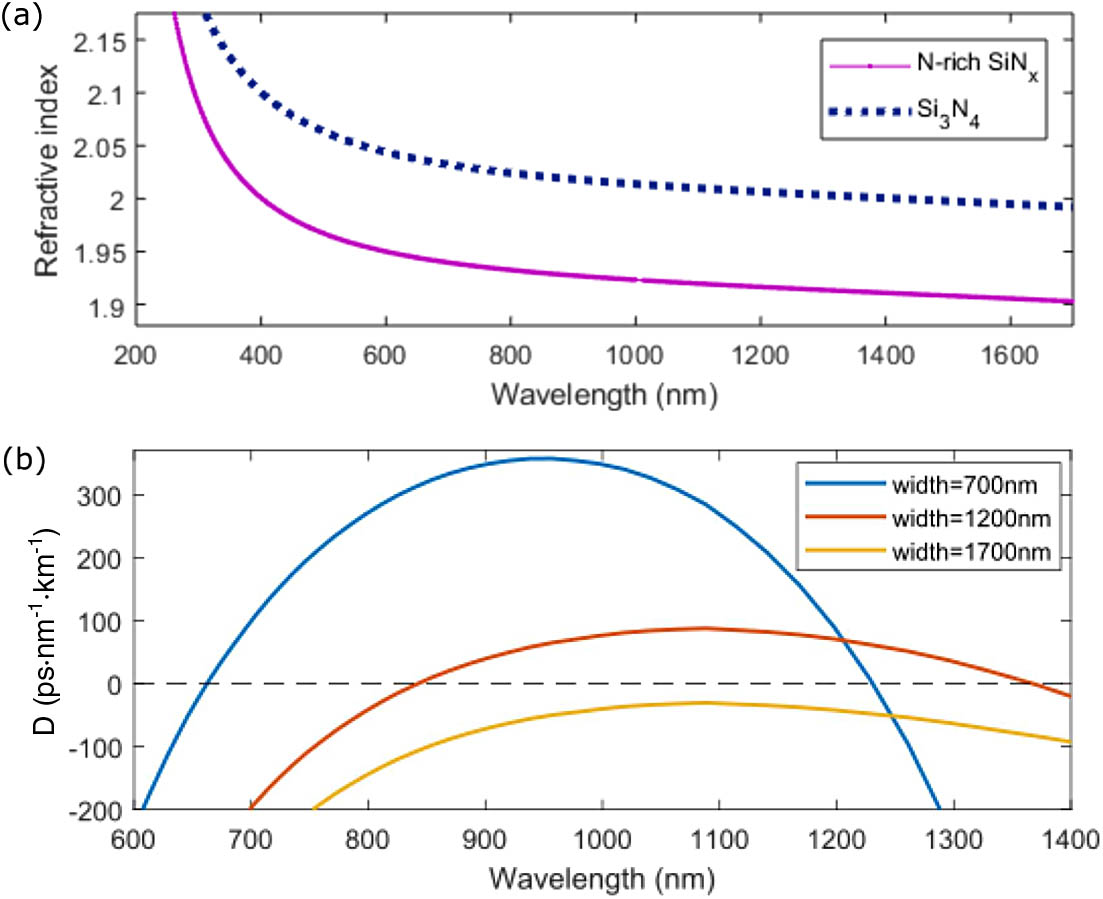
    Fig. 2. (a) Refractive index of N-rich SiNx measured by ellipsometry compared to Si3N4; (b) calculated dispersion parameter in an N-rich SiNx waveguide for different widths.
    Schematic view of the experimental setup. HWP, half-wave plate; PBS, polarization beam splitter; 60× and 20×, objectives.
    Fig. 3. Schematic view of the experimental setup. HWP, half-wave plate; PBS, polarization beam splitter; 60× and 20×, objectives.
    (a) Experimental spectra for the 8.6 mm-long, 1200 nm-wide waveguide (blue dotted line) and the threefold 3 mm-long waveguide (black line) for an input peak power of 3.8 kW; (b) and (c) optical images of the 3 mm-long straight waveguide and the 8.6 mm-long spiral, respectively, from above, showing green and blue scattered light; (d) experimental (black lines) and simulated (green lines) spectra for different input peak powers; from bottom to top: 250 W, 950 W, 3.8 kW. Curves are arbitrarily shifted for better understanding. (e) Spectral evolution along the propagation direction for the simulated SCG 3.8 kW peak power.
    Fig. 4. (a) Experimental spectra for the 8.6 mm-long, 1200 nm-wide waveguide (blue dotted line) and the threefold 3 mm-long waveguide (black line) for an input peak power of 3.8 kW; (b) and (c) optical images of the 3 mm-long straight waveguide and the 8.6 mm-long spiral, respectively, from above, showing green and blue scattered light; (d) experimental (black lines) and simulated (green lines) spectra for different input peak powers; from bottom to top: 250 W, 950 W, 3.8 kW. Curves are arbitrarily shifted for better understanding. (e) Spectral evolution along the propagation direction for the simulated SCG 3.8 kW peak power.
    Integrated dispersion for the two sections of the waveguide.
    Fig. 5. Integrated dispersion for the two sections of the waveguide.
    (a) First-order degree of coherence plotted as a function of wavelength and propagation distance; (b) and (c) individual simulated spectra (blue lines), average of all the spectra (black line), and degree of mutual coherence (orange line) for a 3 mm-long and a 1.7 mm-long waveguide, respectively.
    Fig. 6. (a) First-order degree of coherence plotted as a function of wavelength and propagation distance; (b) and (c) individual simulated spectra (blue lines), average of all the spectra (black line), and degree of mutual coherence (orange line) for a 3 mm-long and a 1.7 mm-long waveguide, respectively.
    Christian Lafforgue, Sylvain Guerber, Joan Manel Ramirez, Guillaume Marcaud, Carlos Alonso-Ramos, Xavier Le Roux, Delphine Marris-Morini, Eric Cassan, Charles Baudot, Frédéric Boeuf, Sébastien Cremer, Stéphane Monfray, Laurent Vivien. Broadband supercontinuum generation in nitrogen-rich silicon nitride waveguides using a 300 mm industrial platform[J]. Photonics Research, 2020, 8(3): 352
    Download Citation