Abstract
Owing to its thickness-modulated direct energy band gap, relatively strong light–matter interaction, and unique nonlinear optical response at a long wavelength, few-layer black phosphorus, or phosphorene, becomes very attractive in ultrafast photonics applications. Herein, we synthesized a graphene/phosphorene nano-heterojunction using a liquid phase-stripping method. Tiny lattice distortions in graphene and phosphorene suggest the formation of a nano-heterojunction between graphene and phosphorene nanosheets. In addition, we systematically investigate their nonlinear optical responses at different wavelength regimes. Our experiments indicate that the combined advantages of ultrafast relaxation, broadband response in graphene, and the strong light–matter interaction in phosphorene can be combined together by nano-heterojunction. We have further fabricated two-dimensional (2D) nano-heterojunction based optical saturable absorbers and integrated them into an erbium-doped fiber laser to demonstrate the generation of a stable ultrashort pulse down to 148 fs. Our results indicate that a graphene/phosphorene nano-heterojunction can operate as a promising saturable absorber for ultrafast laser systems with ultrahigh pulse energy and ultranarrow pulse duration. We believe this work opens up a new approach to designing 2D heterointerfaces for applications in ultrafast photonics and other research. The fabrication of a 2D nano-heterojunction assembled from stacking different 2D materials, via this facile and scalable growth approach, paves the way for the formation and tuning of new 2D materials with desirable photonic properties and applications.1. INTRODUCTION
In recent years, two-dimensional (2D) materials including graphene (GR) [1], topological insulators [2], and transition metal dichalcogenides [3,4] have attracted tremendous interest among laser researchers, particularly for passive -switching and mode-locking lasers. Passively -switched and ultrashort pulse fiber lasers have extensive applications in various fields, including material processing, remote sensing, ranging finding, optical communications, microstructure fabrication, spectroscope, and biomedical research [5–9]. Moreover, passive mode-locking is an effective method to generate femtosecond pulses where saturable absorbers (SAs) or mode-locked ones are popularly used for environmentally stable and self-starting operation of the laser. GR possesses the intrinsic advantages of an ultrafast recovery time, higher damage threshold, lower saturation intensity, and a broad absorption band [10]. Black phosphorus (BP), a direct band gap material, has received much attention because of its relatively higher carrier mobility. Recently, Zhang et al. reported that ultrasmall BP nanosheets (also BP quantum dots) show excellent nonlinear optical saturable absorption with a modulation depth of 36% and a saturable intensity of about [11]. BP, however, is unstable under ambient conditions; therefore, additional treatments are required to protect BP from oxidation. More recently, a GR- heterostructure SA achieved excellent performance in terms of mode-locking operation and -switching operation: Their highest -switching pulse energy is 93.18 nJ, and the pulse width of mode-locking pulses is 837 fs [12,13].
Here, a GR-BP mixture was prepared by a liquid phase exfoliation method using N-methyl-2-pyrrolidone (NMP), which was similar to the mixture previously reported [14,15]. Such GR-BP has a better performance compared to pristine GR and BP individually. The GR-BP nano-heterojunction is endowed with an increased signal stability of BP after it is combined with GR. Passive -switching, femtosecond passively fundamental mode-locking, harmonic mode-locking (HML), and mode-locked pulses were investigated. In passive -switching operation, we obtained a stable maximum pulse energy of 267.5 nJ. It has a markedly higher single pulse energy than the value of a GR-based SA [16–18]. In passive mode-locked operation, we achieved a pulse at central wavelength of 1531 nm with a pulse duration of 148 fs, which is dramatically narrower than that in previous studies on BP. The study also presents the femtosecond fundamental and harmonic mode-locked fiber laser with a GR-BP SA. Our results indicate that a GR-BP mixture exhibits excellence in optical nonlinearity as a promising nonlinear optical device for ultrafast photonics and high-energy operation.
2. RESULTS AND DISCUSSION
A. Fabrication and Characterization of GR-BP SA
BP bulk (99.998%) was purchased from a commercial supplier (smart-elements, GmBH, Vienna, Austria); graphite flakes (99.95%) and NMP (, anhydrous) came from Aladdin Co., Ltd. (Fengxian District, Shanghai, China). All the other reagents were of analytical purity and used as received without further purification. The mixture of GR and BP was prepared by liquid phase stripping. Briefly, 80 mg graphite and 10 mg BP were put into 30 mL NMP and then dispersed at 6000 rpm in for 5 min to achieve a uniform dispersion liquid. Next, the dispersion was sonicated in an ultrasonic bath continuously for 9 h at a power of 300 W. To avoid oxidation at an elevated temperature, ice bags were used to keep the temperature below 20°C. Pure GR and BP dispersed in NMP was prepared under the same condition. Miscible liquids with a series of concentrations were prepared by the mother liquor. 1 mL of the GR-BP turbid liquid was centrifuged at a speed of 9000 rpm for 10 min and then the sediment was dispersed in absolute ethyl alcohol and then dropped onto a silicon substrate for scanning electron microscope (SEM) and element mapping measurement. After centrifuging the liquid supernatant at a speed of 12000 rpm for 10 min, the sediment was also dispersed in absolute ethyl alcohol and then dropped onto silicon substrate and carbon film copper net for atomic force microscope (AFM) and high-resolution transmission electron microscopy (HRTEM) measurements, respectively. Absolute ethyl alcohol was employed as a dispersion liquid for the sediment. The morphologies of the sediment were obtained by a field emission scanning electron microscopy (Hitachi SU8010) with an energy dispersive spectroscope (EDS). Thicknesses measurement was executed using an AFM (Bruker Dimension Icon). HRTEM and a selective area electron diffraction (SAED) pattern were obtained by an HRTEM (FEI Tecnai G2 F30). Raman spectra was performed on a Raman spectrometer (Renishaw inVia Reflex, 514 nm) at room temperature. Absorption performances were obtained by a UV-vis spectrophotometer (Agilent Cary 5000) at room temperature.
Sign up for Photonics Research TOC. Get the latest issue of Photonics Research delivered right to you!Sign up now
As shown in Fig. 1(a), GR and BP are large-sized nanosheets after exfoliation, suggesting that they may inherit the merits of the bulks. Carbon [Fig. 1(c)] and phosphorus [Fig. 1(d)] elements distribute in all the areas. No bulk product was observed, indicating a complete exfoliation of graphite and bulk BP. The transmission electron microscopy (TEM) image [Fig. 1(i)] consists of two kinds of separate sheets. To probe more information, HRTEM [Fig. 1(e)] and SAED [Fig. 1(f)] images were obtained. Figure 1(e) shows an interplanar spacing of 0.350 and 0.336 nm, which were ascribed to the (002) plane of GR and (021) plane of the BP crystal, respectively. The SAED image [Fig. 1(f)] taken from the rectangular region in Fig. 1(e) contains diffraction spots of both GR and BP, while the SAED image [Fig. 1(j)] taken from bigger slices in Fig. 1(i) corresponds to GR. All the analyses mentioned above suggest small BP sheets adhere to larger GR sheets and a phase boundary (i.e., mismatched region) is located between the GR and BP [pentagon area in Fig. 1(e)]. Moreover, lattice distortions are observed in both BP and GR. Specifically, interplanar spacing of BP is smaller than the values of pristine BP (JCPDS card No. 74-1878), while the interplanar spacing of GR is wider than the values of pristine GR (JCPDS card No. 99-0057).
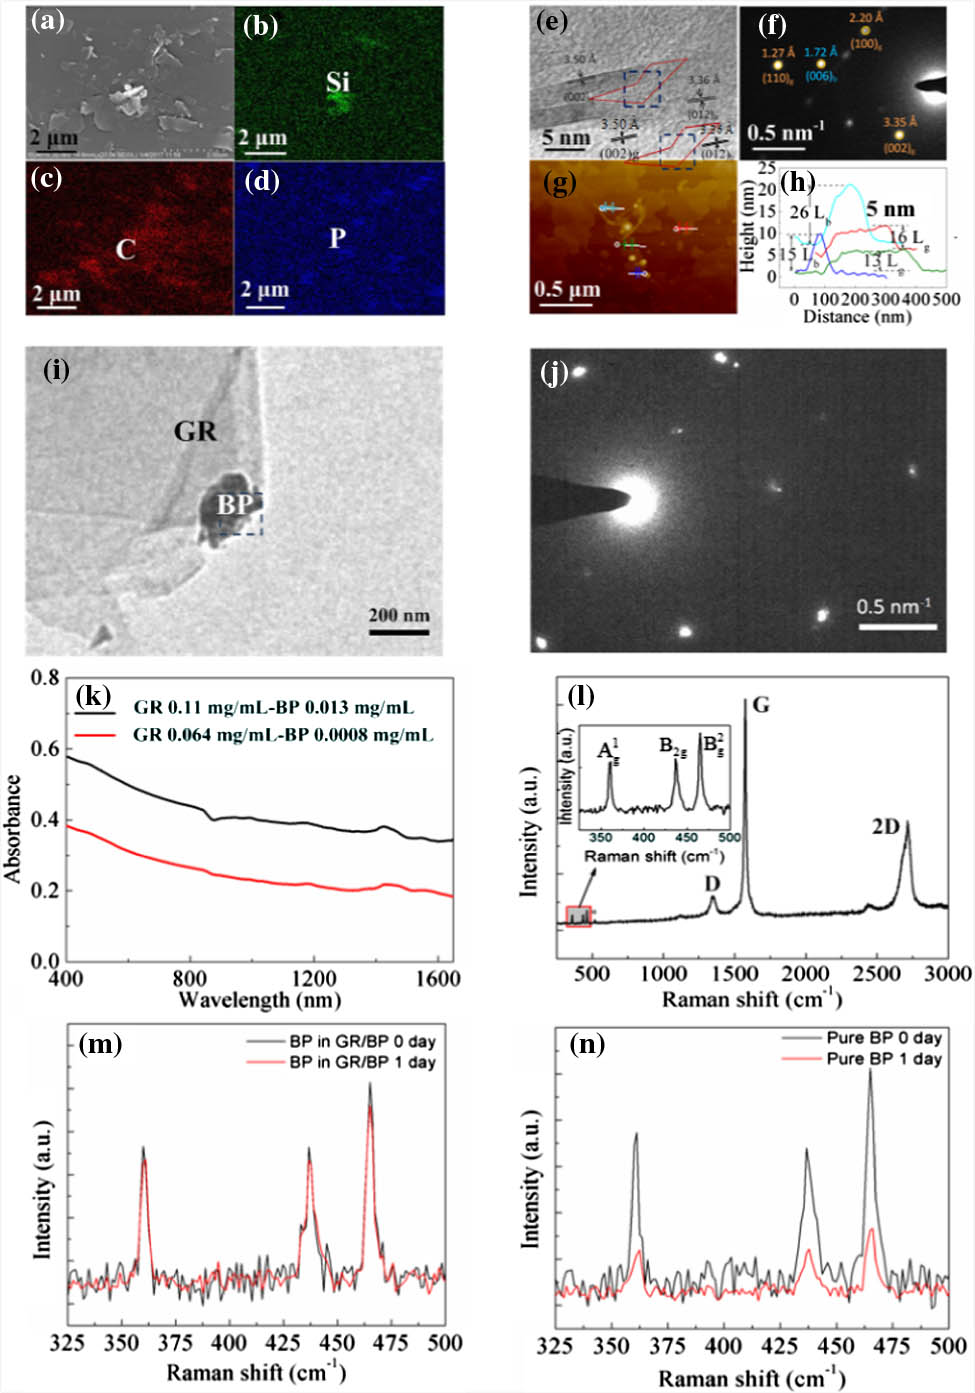
Figure 1.Characterization of GR-BP SA. (a) SEM image. (b)–(d) EDS images of BP-GR on Si substrate. (e) HRTEM. (f) The SAED pattern from the rectangular region in (e). (g) AFM pattern. (h) The corresponding heights of the GR-BP sheets. (i) TEM image of the GR-BP sheets. (j) SAED pattern from the rectangular region in (i). (k) Absorption spectrum. (l) Raman spectra of GR/BP exposed in the air for 0 day. (m) Raman spectrum of BP in GR/BP in the air for 0 and 1 day. (n) Raman spectrum of pure BP exposed in the air for 0 and 1 day.
In an ultrasound bath, graphite and BP bulk are separated into layers. Meanwhile, 2D sheets are reuniting into a larger one through van der Waals interaction. Once the speed of reuniting reaches that of separating, a common balance point is obtained. The interplanar spacing of (002) in graphite is 0.3348 nm (JCPDS card No. 99-0057), and the value of (012) in BP is 0.3363 nm (JCPDS card No. 74-1878). Such a small lattice mismatch (0.45%) is suitable for the formation of van der Waals interfaces [19]. An AFM image of the exfoliated products reveals the presence of two kinds of shapes [Fig. 1(g)]. The GR sheets (darker slices) are as large as ca. , while the BP sheets (brighter slices) are as large as ca. . Height-profiling [Fig. 1(h)] of GR nanosheets reveals thicknesses between ca. 4.4–5.4 nm (13-16 layers) with well-defined edges while the thicknesses of BP are between ca. 7.9–13.6 nm (15-26 layers). The linear absorption spectra GR/BP are shown in Fig. 1(k), which reveals that GR/BP SA has the advantage of a broadband response. Raman spectrum of GR/BP at room temperature is shown in Fig. 1(l). Raman peak of silicon is located at (marked with *), which is consistent with other report [20]. Raman peaks in 361.2, 436.6, and is ascribed to , , and of BP Raman modes, respectively; [21] while 1344.9, 1576.4, and is D, G, and the 2D mode of GR, respectively [22]. The coexistence of GR and BP modes suggest the coexistence of the two materials. It is widely known that the degeneration of BP in air leads to reduced Raman intensities [23]. It directly affects the long-term stability of BP and restricts its applications. To further investigate its stability, it had been exposed to air for 1 day and pure BP was used as a comparison. In-situ measurements were performed on two different samples. After one day, the intensities of Raman peaks for GR-BP presented a tiny decrease while obvious decreases for pure BP were observed [Figs. 1(m) and 1(n)]. We therefore can infer that BP is endowed with increased stability through the combination with GR. We believe this work provides a new insight that will help improve the stability of BP to develop desired photonic applications.
B. Nonlinear Optical Absorption Properties of GR-BP SAs
To characterize the nonlinear optical response of the GR-BP SAs, an open aperture Z-scan technique was employed using a typically experimental setup similar to our previous one [13]. The pump source used in this experiment is a femtosecond laser with 200 fs pulse duration and a center wavelength of 1500 nm. The laser pulses were generated from an optical parametric amplifier pumped by a mode-locked Ti: sapphire oscillator with a seeded repetition rate of 1 kHz. The average power of the femtosecond pulse was then attenuated to 2.1 mW for the Z-scan experiment. Experiment results of the open aperture Z-scan measurements at 1500 nm are shown in Fig. 2. The key SA parameters of saturation intensity and the modulation depth can be tuned by changing the solution concentration of GR-BP SAs. Figure 2 shows the linear transmittance of the GR-BP solution with solution concentration B (GR -BP ), which is slightly larger than solution concentration A (GR -BP ). While the enhanced by 191% and also greatly enhanced by 1566%. This opens a new direction for tuning new 2D materials.

Figure 2.Nonlinear optical response of the as-prepared GR-BP SAs. (a) Nonlinear transmission curve of GR-BP solution concentration A. (b) Nonlinear transmission curve of GR-BP solution concentration B.
C. Ultrafast Photonics Applications
Figure 3 displays the configuration of the pulsed laser or ultrashort pulsed laser based on GR-BP. A laser diode (LD) serves as the pump source with a maximum power of 700 mW and an emission wavelength of 980 nm. The pump was delivered into a piece of 4.0 m long erbium-doped fiber (EDF) via a 980/1550 nm fused wavelength division multiplexer (WDM) coupler. The EDF absorption coefficient is at 980 nm. The polarization-independent isolator (PI-ISO) forced unidirectional signal propagation inside the cavity while the signal was coupled out using a 5% optical coupler (OC). A polarization controller (PC) allows us to fine-tune the intracavity polarization to start the -switched, mode locked operation or harmonic mode locked. D-shaped fiber (DF) was immersed in GR-BP solution. The interaction length of the D-shaped area is 10 mm, and the distance from the fiber core boundary to the D-shaped area is 2 μm. The GR-BP was inserted between the PC and the WDM coupler. The total cavity length is , consisting of 4.0 m EDF and SMF-28 fiber with dispersion parameters of and , respectively. The net dispersion is estimated as . It is worth emphasizing that the all used components were polarization insensitive and used -switching, mode locking and an HML mechanism based only on saturable absorption of GR-BP.
Figure 3.Configuration of the pulsed laser or ultrashort pulsed laser based on GR-BP.
1. Q-Switched Laser
In the -switched laser, the GR-BP solution with a concentration in GR of -BP was used as an optical SA. When the pump power exceeds a threshold of 67 mW, a stable -switched pulse can be achieved after slightly tuning the PC. The characteristics of the -switched pulses are measured and shown in Fig. 4. The typical -switching output spectrum is shown in Fig. 4(a). It can be seen that the central wavelength is 1560.62 nm and its 3 dB bandwidth is 0.14 nm. Figure 4(b) gives the single pulse profile in temporal domain, which presents a Gaussian-like shape with a full width at half-maximum (FWHM) of 4.0 μs and a symmetric intensity profile. Its corresponding repetition rate is measured to be 45.02 kHz. Figure 4(c) shows the typical pulse train with uniform intensity distribution, which reveals a repetition rate of 45.05 kHz, corresponding to a time interval of 22.2 μs. The insert of Fig. 4(c) shows the pulse train in 2 ms scale. We did not observe peak intensity modulation on the pulse train, which confirms the high stability of the -switching generation. The -switching state was further investigated with a stable -switching pulse and various pulse durations at different pump power from 67 to 607 mW. A strong signal peak of corresponding radio frequency (RF) spectrum with a repetition rate of 45.02 kHz is clearly observed and the signal-to-noise ratios (SNR) is over 44 dB, as shown in Fig. 4(d).
Figure 4.Characteristics of the -switched pulses. (a) -switching output spectrum. (b) Single pulse profile. (c) Output pulse train. (d) RF spectrum. (e) Output power and pulse energy as a function of the pump power, respectively. (f) Output repetition rate and pulse duration as a function of the pump power, respectively.
The output power (blue spheres and line) and the corresponding pulse energy (red spheres and line) as a function of the pump power, respectively, are depicted in Fig. 4(e). The threshold of pump power is 67 mW, and the output power increases linearly with the pump power increasing. At the maximum pump power of 607 mW, the single pulse energy is up to 267.5 nJ, which is about 287% larger than that of the fiber -switching with GR- heterostructure SA [12], and is also about 21 times larger than the previous record of fiber -switching with BP SA [24]. It shows the performance comparable to those of the -switch pulses in EDF lasers with SAs, such as GR [25] and BP [26]. Generally, in contrast with the mode-locked lasers, -switching lasers output larger pulse energy () [27,28], which is more relevant for applications where laser pulses with high energy are needed. We believed that the higher output power and pulse energy can be obtained by using high-gain fiber (e.g., double-clad fiber) and optimizing the cavity designs (e.g., output coupling ratio, cavity loss) [29]. A typical characteristic of -switched lasers is dependence on the pump power of pulse duration and the repetition rate. Figure 4(f) shows the repetition rate (blue spheres and line) and pulse duration (red spheres and line) as function of the pump power, respectively. The measurement precision was improved by averaging 10 measurements. The pulse repetition rate increases approximately linearly from 22.45 to 76.63 kHz while the pulse width reduces from 5.99 to 3.28 μs, when the pump power varies between 67 and 607 mW. When the pump power increases, the laser provides more gain and is easier to reach the saturation fluence of GR-BP, thus the pulse width reduces and the repetition rate increases.
2. Mode-Locked Laser
By changing the length of SMF, the cavity net dispersion was tuned. There are two sets of mode-locked laser experimental data presented to study ultrashort mode-locked pulsed lasers with respect to various conditions: (A) a GR-BP solution concentration of GR -BP and (B) a GR-BP solution concentration of GR -BP .
Condition (A) solution concentration A (GR -BP ): After careful adjustment, the stable continuous wave mode locked (CWML) based on a GR-BP solution with a concentration of GR -BP is demonstrated, and the results are displayed in Figs. 5(a)–5(d). A CWML regime is achieved when the pump power is larger than 72 mW, corresponding to the output power of 2 mW. The mode-locked pulse train is presented in Fig. 5(a). The time interval between two pulses is 134.6 ns, which corresponds to a 7.43 MHz repetition rate. The insert of Fig. 5(a) shows uniform intensity pulses of a mode-locked laser, which shows a highly stable operation of the laser. The optical spectrum of fundamental mode-locked pulses is centered at 1529.92 nm and 3 dB spectral width is 3.4 nm, as shown in Fig. 5(b). The corresponding autocorrelation trace illustrated in Fig. 5(c). The FWHM is 1.29 ps, which means the pulse width is 820 fs if fit is used, with a time-bandwidth product (TBP) of 0.35. A strong signal peak with a mode-locked repetition rate of 7.43 MHz is clearly observed and SNR is measured at about 52 dB, as shown in Fig. 5(d).
Figure 5.Typical mode-locking characteristics. (a) Pulse train. (b) Optical spectrum. (c) Autocorrelation trace. (d) RF spectrum.
Condition (B) solution concentration B (GR -BP ): This section shows the experimental data for studying mode-locked fiber laser based on a GR-BP solution with a concentration in GR -BP , instead of GR -BP . This will allow us to get a deeper understanding regarding the SA and mode- locking properties of the nano-heterojunction changes with respect to the solution concentration of GR-BP. Stable CWML operation is also achieved in Condition B and the pulse trains is illustrated in Fig. 6(a). As shown in the inset figure, the output pulse shows only CWML performance, with no sign of -switching operation. There is a slight different in the time interval between Figs. 5(a) and 6(a), because of the cavity length variances due to welding fiber when we put another concentration in our laser cavity. Figure 6(b) plots the output spectrum of the laser at the pump power of 460 mW. The full width at 3 dB is , larger (570%) than in the mode-locked laser in Condition A, and also larger than previous nano-heterojunction SA fiber lasers. The autocorrelation trace of the corresponding mode-locked pulse at 460 mW pump power is shown in Fig. 6(c). Using a pulse profile fit, the pulse duration () was calculated as 148 fs. The pulse duration is much shorter (554%), compared to that of the GR-BP solution with a concentration of GR -BP . There is a dramatic increase (570%) of the full width of the spectrum, while a reduction (554%) of pulse duration occurs as the BP solution concentration changes from 0.04 to . Note that the pulse duration 148 fs is about 83% shorter than the previous record for fiber mode-locked with BP SA [30,31]. The TBP for such pulses is 0.37. As shown in Fig. 6(d), the measured RF spectrum is free of any spectral modulations and indicates that the SNR was better than 58 dB. The repetition frequency was about 7.5 MHz, resulting from the length of the cavity.
Figure 6.Typical mode-locking characteristics. (a) Pulse train. (b) Optical spectrum. (c) Autocorrelation trace. (d) RF spectrum.
3. Harmonic Mode-Locked Laser
HML is achieved by increasing the pump power and slightly adjusting the orientation of the PC in the fiber laser with respect to GR-BP solution concentration A. It is noted that the HML phenomenon cannot been observed in fiber laser with respect to GR-BP solution B. Figures 7(a)–7(c) show the pulse trains of HML with respect to the 21st, 28th, and 40th harmonics of the fundamental repetition rate, respectively. From the inset figure of Figs. 7(a)–7(c), the laser operates at a stable state of HML during various harmonics of fundamental repetition rate. Figure 7(c) is the pulse trains of the highest harmonics in this experiment, which corresponds to maximum pump power of 614 mW. The corresponding spectrum of HML pulses is shown in Fig. 7(d). The central wavelength and 3 dB bandwidth are 1529 and 4 nm, respectively. Figure 7(e) illustrates the corresponding autocorrelation trace. The FWHM is 1.47 ps and the real pulse duration is inferred as 865 fs for pulse profile fit. The TBP is 0.44. Compared to other reports, we believe our pulse duration experimental result is excellent. To survey the HML performance, we measured the RF spectra. As shown in Fig. 7(f), the repetition rate is 295.6 MHz, which is the 40th harmonics of fundamental repetition rate. Figure 7(f) denotes the corresponding RF spectrum of HML pulses and the repetition rate of HML and its SNR is 295.6 MHz and , respectively.
Figure 7.Typical HML characteristics. (a) 21st of harmonics pulse train. (b) 28th of harmonics pulse train. (c) 40th of harmonics pulse train (d) Optical spectrum. (e) Autocorrelation trace. (f) RF spectrum.
The output performances of the laser oscillator were observed using an optical spectrum analyzer (Yokogawa, AQ6370C), a 1 GHz digital oscilloscope (Tektronix, DPO4104B), a frequency analyzer (RIGOL, DSA815), and an optical autocorrelator (APE, PulseCheck).
3. CONCLUSIONS
In conclusion, we employed a facile liquid phase-stripping method to synthesize a GR-BP nano-heterojunction. BP was endowed, which increased the signal stability after being combined with GR. GR-BP has a better performance compared to either pristine GR or BP. We demonstrated that conclusion using passive -switching and a femtosecond mode-locked fiber laser with GR-BP SA. In the passive -switching operation, we obtained a stable maximum pulse energy of 267.5 nJ, which is about 287% larger than that obtained with the heterostructure SA, and is also about 21 times higher than the previous record of fiber -switching with BP SA. In passive mode-locked operation, the ultrashort pulse at a central wavelength of 1531 nm with pulse duration of 148 fs was achieved, which is about 83% shorter than the previous record of fiber mode-locked with BP SA. We also demonstrated the harmonic fiber mode-locking laser with GR-BP SA, and its repetition rate is 295.6 MHz, which is the 40th harmonic of the fundamental repetition rate. GR-BP mixture has the potential to be a candidate for an effective SA for ultrafast laser photonics.
References
[1] A. K. Geim, K. S. Novoselov. The rise of graphene. Nat. Mater., 6, 183-191(2007).
[2] D. Hsieh, D. Qian, L. Wray, Y. Xia, Y. S. Hor, R. J. Cava, M. Z. Hasan. A topological Dirac insulator in a quantum spin Hall phase. Nature, 452, 970-974(2008).
[3] P. Tonndorf, R. Schmidt, P. Boettger, X. Zhang, J. Boerner, A. Liebig, M. Albrecht, C. Kloc, O. Gordan, D. R. T. Zahn, S. M. de Vasconcellos, R. Bratschitsch. Photoluminescence emission and Raman response of monolayer MoS2, MoSe2, and WSe2. Opt. Express, 21, 4908-4916(2013).
[4] H. Li, Q. Zhang, C. C. R. Yap, B. K. Tay, T. H. T. Edwin, A. Olivier, D. Baillargeat. From bulk to monolayer MoS2: evolution of Raman scattering. Adv. Funct. Mater., 22, 1385-1390(2012).
[5] U. Keller. Recent developments in compact ultrafast lasers. Nature, 424, 831-838(2003).
[6] M. Laroche, A. M. Chardon, J. Nilsson, D. P. Shepherd, W. A. Clarkson, S. Girard, R. Moncorge. Compact diode-pumped passively Q-switched tunable Er-Yb double-clad fiber laser. Opt. Lett., 27, 1980-1982(2002).
[7] R. Paschotta, R. Haring, E. Gini, H. Melchior, U. Keller, H. L. Offerhaus, D. J. Richardson. Passively Q-switched 0.1-mJ fiber laser system at 1.53 μm. Opt. Lett., 24, 388-390(1999).
[8] V. S. Letokhov. Laser biology and medicine. Nature, 316, 325-330(1985).
[9] I.-B. Sohn, Y. Kim, Y.-C. Noh, J.-C. Ryu, J.-T. Kim. Microstructuring of optical fibers using a femtosecond laser. J. Opt. Soc. Korea, 13, 33-36(2009).
[10] Z. Wang, H. Mu, C. Zhao, Q. Bao, H. Zhang. Harmonic mode-locking and wavelength-tunable Q-switching operation in the graphene-Bi2Te3 heterostructure saturable absorber-based fiber laser. Opt. Eng., 55, 081314(2016).
[11] Y. Xu, Z. Wang, Z. Guo, H. Huang, Q. Xiao, H. Zhang, X.-F. Yu. Solvothermal synthesis and ultrafast photonics of black phosphorus quantum dots. Adv. Opt. Mater., 4, 1223-1229(2016).
[12] H. Mu, Z. Wang, J. Yuan, S. Xiao, C. Chen, Y. Chen, Y. Chen, J. Song, Y. Wang, Y. Xue, H. Zhang, Q. Bao. Graphene-Bi2Te3 heterostructure as saturable absorber for short pulse generation. ACS Photon., 2, 832-841(2015).
[13] F. Bonaccorso, Z. Sun, T. Hasan, A. C. Ferrari. Graphene photonics and optoelectronics. Nat. Photonics, 4, 611-622(2010).
[14] Z. Sun, H. Xie, S. Tang, X. F. Yu, Z. Guo, J. Shao, H. Zhang, H. Huang, H. Wang, P. K. Chu. Ultrasmall black phosphorus quantum dots: synthesis and use as photothermal agents. Angew. Chem., 54, 11526-11530(2015).
[15] X. Zhang, H. Xie, Z. Liu, C. Tan, Z. Luo, H. Li, J. Lin, L. Sun, W. Chen, Z. Xu, L. Xie, W. Huang, H. Zhang. Black phosphorus quantum dots. Angew. Chem., 54, 3653-3657(2015).
[16] Z. Luo, M. Zhou, J. Weng, G. Huang, H. Xu, C. Ye, Z. Cai. Graphene-based passively Q-switched dual-wavelength erbium-doped fiber laser. Opt. Lett., 35, 3709-3711(2010).
[17] D. Lv, H. Li, H. Xia, S. Zhang, Y. Liu, Z. Wang, Y. Chen. Passively Q-switched linear-cavity erbium-doped fiber laser based on graphene saturable absorber. Proceedings of 12th International Conference on Optical Communications and Networks (ICOCN), 1-3(2013).
[18] D.-P. Zhou, L. Wei, W.-K. Liu. Tunable graphene Q-switched erbium-doped fiber laser with suppressed self-mode locking effect. Appl. Opt., 51, 2554-2558(2012).
[19] G. Gao, W. Gao, E. Cannuccia, J. Taha-Tijerina, L. Balicas, A. Mathkar, T. N. Narayanan, Z. Liu, B. K. Gupta, J. Peng, Y. Yin, A. Rubio, P. M. Ajayan. Artificially stacked atomic layers: toward new van der Waals solids. Nano Lett., 12, 3518-3525(2012).
[20] Z. Guo, H. Zhang, S. Lu, Z. Wang, S. Tang, J. Shao, Z. Sun, H. Xie, H. Wang, X.-F. Yu, P. K. Chu. From black phosphorus to phosphorene: basic solvent exfoliation, evolution of Raman scattering, and applications to ultrafast photonics. Adv. Funct. Mater., 25, 6996-7002(2015).
[21] S. Zhang, J. Yang, R. Xu, F. Wang, W. Li, M. Ghufran, Y. W. Zhang, Z. Yu, G. Zhang, Q. Qin, Y. Lu. Extraordinary photoluminescence and strong temperature/angle-dependent Raman responses in few-layer phosphorene. ACS Nano, 8, 9590-9596(2014).
[22] L. Jiao, X. Wang, G. Diankov, H. Wang, H. Dai. Facile synthesis of high-quality graphene nanoribbons. Nat. Nanotechnol., 5, 321-325(2010).
[23] A. Favron, E. Gaufres, F. Fossard, A. L. Phaneuf-L’Heureux, N. Y. Tang, P. L. Levesque, A. Loiseau, R. Leonelli, S. Francoeur, R. Martel. Photooxidation and quantum confinement effects in exfoliated black phosphorus. Nat. Mater., 14, 826-832(2015).
[24] Z. Ruwei, L. Jing, Z. Baitao, L. Xiaowen, S. Xiancui, W. Yiran, L. Fei, Z. Haikun, H. Jingliang. Triwavelength synchronously mode-locked fiber laser based on few-layered black phosphorus. Appl. Phys. Express, 9, 092701(2016).
[25] H. Ahmad, M. Z. Zulkifli, F. D. Muhammad, A. Z. Zulkifli, S. W. Harun. Tunable graphene-based Q-switched erbium-doped fiber laser using fiber Bragg grating. J. Mod. Opt., 60, 202-212(2013).
[26] Y. Chen, G. Jiang, S. Chen, Z. Guo, X. Yu, C. Zhao, H. Zhang, Q. Bao, S. Wen, D. Tang, D. Fan. Mechanically exfoliated black phosphorus as a new saturable absorber for both Q-switching and mode-locking laser operation. Opt. Express, 23, 12823-12833(2015).
[27] D. Li, H. Jussila, L. Karvonen, G. Ye, H. Lipsanen, X. Chen, Z. Sun. Polarization and thickness dependent absorption properties of black phosphorus: new saturable absorber for ultrafast pulse generation. Sci. Rep., 5, 15899(2015).
[28] M. Leigh, W. Shi, J. Zong, J. Wang, S. Jiang, N. Peyghambarian. Compact, single-frequency all-fiber Q-switched laser at 1 μm. Opt. Lett., 32, 897-899(2007).
[29] J. J. Zayhowski, P. L. Kelley. Optimization of Q-switched lasers. IEEE J. Quantum Electron., 27, 2220-2225(1991).
[30] J. Sotor, G. Sobon, W. Macherzynski, P. Paletko, K. M. Abramski. Black phosphorus saturable absorber for ultrashort pulse generation. Appl. Phys. Lett., 107, 051108(2015).
[31] Y. Chen, S. Chen, J. Liu, Y. Gao, W. Zhang. Sub-300 femtosecond soliton tunable fiber laser with all-anomalous dispersion passively mode locked by black phosphorus. Opt. Express, 24, 13316-13324(2016).


