• Chinese Physics B
  • Vol. 29, Issue 8, (2020)
Bing-Jie Wang, Li Xu, Wei-You Zeng, and Qing-Lan Wang
Author Affiliations
  • College of Science, Hubei University of Automotive and Technology, Shiyan 442002, China
  • show less
    DOI: 10.1088/1674-1056/ab969d Cite this Article
    Bing-Jie Wang, Li Xu, Wei-You Zeng, Qing-Lan Wang. New measuring method of fiber alignment in precision torsion pendulum experiments[J]. Chinese Physics B, 2020, 29(8): Copy Citation Text show less
    A schematic drawing of the setup. The laser with large beam incidents into the CCD camera. Both of them are fixed on the turntable and rotated with it. The top of the fiber is fixed to a two-axis stage which is used to adjust the position of the fiber.
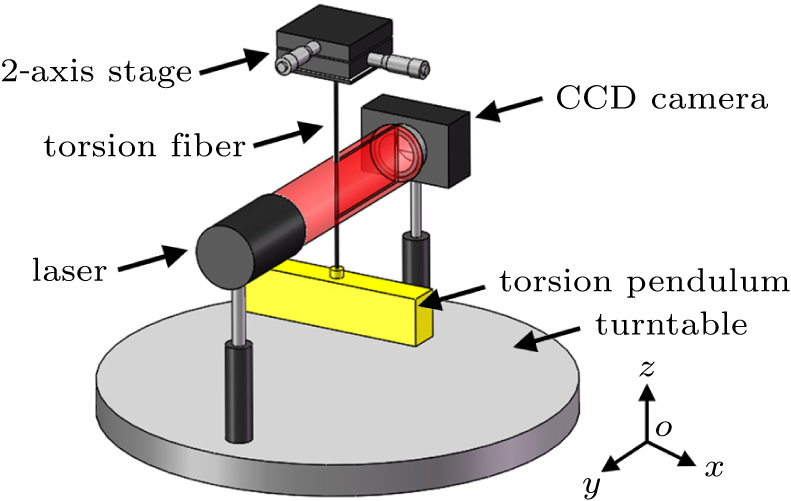
    Fig. 1. A schematic drawing of the setup. The laser with large beam incidents into the CCD camera. Both of them are fixed on the turntable and rotated with it. The top of the fiber is fixed to a two-axis stage which is used to adjust the position of the fiber.
    A serial projection images of the fiber are shown when the turntable rotates in 360°. The regularly changed position means that there exists a deviation between the fiber and the center of the turntable.
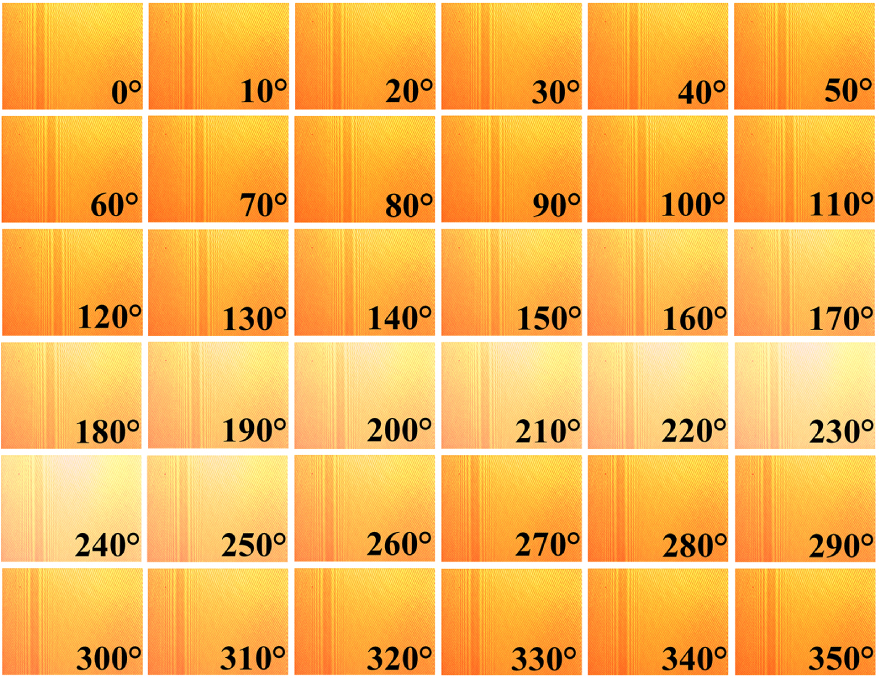
    Fig. 2. A serial projection images of the fiber are shown when the turntable rotates in 360°. The regularly changed position means that there exists a deviation between the fiber and the center of the turntable.
    Projection image of the fiber. The intensity distribution can be explained by Fresnel diffraction pattern of a straight edge: (a) original image and (b) enhanced grayscale intensity image.
    Fig. 3. Projection image of the fiber. The intensity distribution can be explained by Fresnel diffraction pattern of a straight edge: (a) original image and (b) enhanced grayscale intensity image.
    (a) Summarizing the grayscale by column to get the distribution in the horizonal direction. The diffraction pattern shows symmetrically besides the two edges. (b) Searching the local maximum change in the manual chosen range to determine the center of the torsion fiber.
    Fig. 4. (a) Summarizing the grayscale by column to get the distribution in the horizonal direction. The diffraction pattern shows symmetrically besides the two edges. (b) Searching the local maximum change in the manual chosen range to determine the center of the torsion fiber.
    (a) Schematic diagram of the system. By means of 36 images, the deviation result can be calculated. (b) The circle dots represent the deviation in each image obtained by the CCD camera in different angle locations. A sinusoidal curve function is used to fitting the data well. One can get more images in each angle to make the fitting result more precisely, but it is not improved significantly.
    Fig. 5. (a) Schematic diagram of the system. By means of 36 images, the deviation result can be calculated. (b) The circle dots represent the deviation in each image obtained by the CCD camera in different angle locations. A sinusoidal curve function is used to fitting the data well. One can get more images in each angle to make the fitting result more precisely, but it is not improved significantly.
    (a) A serial results have been presented. The circles are getting smaller and smaller after several operations. (b) The last three operations seem to reach the same level.
    Fig. 6. (a) A serial results have been presented. The circles are getting smaller and smaller after several operations. (b) The last three operations seem to reach the same level.
    The distance driven by the Piezo stage versus the information got from the image processing. The points in this figure are analyzed in the same way of image processing mentioned in Section 3.
    Fig. 7. The distance driven by the Piezo stage versus the information got from the image processing. The points in this figure are analyzed in the same way of image processing mentioned in Section 3.
    (a) Scheme of the tilt and wobble motion during the experiment. (b) Two separated coordinates are used to describe the effects by the tilt and wobble. The height from the laser to the plane of the turntable is h + H.
    Fig. 8. (a) Scheme of the tilt and wobble motion during the experiment. (b) Two separated coordinates are used to describe the effects by the tilt and wobble. The height from the laser to the plane of the turntable is h + H.
    r/pixelβ/(°)Δx/pixelΔy/pixelD/pixel
    1st269 ± 5−107 ± 1−79 ± 5−257 ± 5518 ± 3
    2nd191 ± 3−45 ± 1135 ± 3−135 ± 3522 ± 2
    3rd135 ± 2239 ± 1−70 ± 2−116 ± 2511 ± 1
    4th3 ± 1−11 ± 83 ± 1−1 ± 1512 ± 3
    5th2 ± 1−210 ± 18−2 ± 1−1 ± 1509 ± 1
    6th3 ± 1−25 ± 83 ± 1−1 ± 1510 ± 1
    Table 1. Coefficients of the fitting function in deviation measurement.
    Bing-Jie Wang, Li Xu, Wei-You Zeng, Qing-Lan Wang. New measuring method of fiber alignment in precision torsion pendulum experiments[J]. Chinese Physics B, 2020, 29(8):
    Download Citation