
Hong-Tao Hua, Bo Lu, Hua-Guang Gu. Nonlinear mechanism of excitatory autapse-induced reduction or enhancement of firing frequency of neuronal bursting [J]. Acta Physica Sinica, 2020, 69(9): 090502-1
- Acta Physica Sinica
- Vol. 69, Issue 9, 090502-1 (2020)
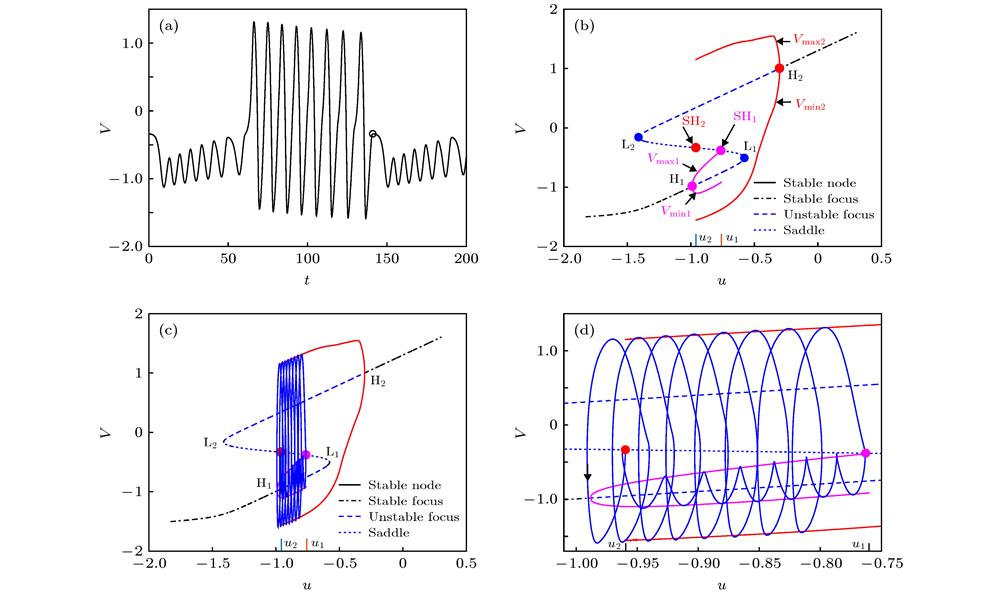
Fig. 1. Bursting pattern and fast/slow variable dissection of the modified FHN model. (a) Period-8 bursting pattern (the position of the hollow circle corresponds to V = –0.3396 and t = 141.15). (b) The bifurcations of the fast subsystem. The black solid line, black dashed line, blue dotted line, and blue dashed line represent the stable node, the stable focus, the saddle, and the unstable focus. There are two fold bifurcation points of equilibrium point L1 and L2 and two Hopf bifurcation points H1 and H2. The maximum (minimum) value of the subthreshold stable limit cycle is represented by the upper (lower) magenta solid line, and the homoclinic bifurcation point SH1 corresponds to u 1 = –0.760022. The maximum (minimum) value of the suprathreshold stable limit cycle corresponds to upper (lower) solid red line, and the homoclinic bifurcation point SH2 corresponds to u 2 = –0.959267. (c) The trajectory of period-8 bursting (solid blue line) and panel (b) plotted in one figure. (d) The partial enlargement of panel (c).
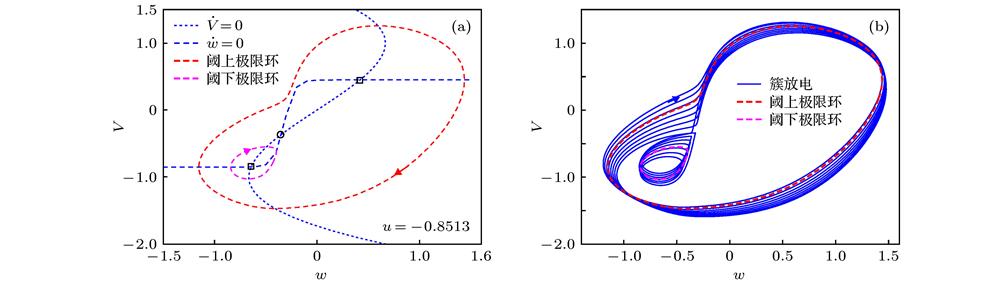
Fig. 2. Dynamical behavior of fast subsystem and whole system in plane (w , V ) of the modified FHN model: (a) The suprathreshold stable limit cycle (red dashed line), the subthreshold stable limit cycle (magenta dashed line), the direction of the trajectory (arrow), and the nullcline of
 (blue dotted line) and
 (blue dashed line) of the fast subsystem corresponds to
 u = –0.8513; “□” represents the unstable focus, and “○” represents the saddle; (b) the projection (solid blue line) of period-8 bursting of the whole system onto the phase plane ( w , V ), and suprathreshold stable limit cycle (red dashed line) and the subthreshold stable limit cycle (magenta dashed line) in panel (a) plotted in one figure.
(blue dotted line) and
(blue dashed line) of the fast subsystem corresponds to Fig. 3. [in Chinese]
Fig. 3. Transition from suprathreshold stable limit cycle (dashed red line) to subthreshold stable limit cycle (dashed magenta line) to terminate the firing (solid black line) in advance induced by excitatory impulse (solid green line) applied at suitable phase near the 1st to 8th trough within burst of the period-8 bursting (dotted blue line), and recover to period-8 bursting after 2, 3, 4, 4, 5, 6 and 7 subthreshold oscillations and one period-9 bursting. (a1), (a2) Δt = 69.7, application phase near the 1st trough; (b1), (b2) Δt = 78.35, application phase near the 2nd trough; (c1), (c2) Δt = 87.15, application phase near the 3rd trough; (d1), (d2) Δt = 96.2, application phase near the 4th trough; (e1), (e2) Δt = 105.55, application phase near the 5th trough; (f1), (f2) Δt = 115.25, application phase near the 6th trough; (g1), (g2) Δt = 125.5, application phase near the 7th trough. Left column: bursting; Right column: The projections (black solid line) in the phase plane (w , V ) corresponding to the part between “►” and “■” of the corresponding left figure, and the suprathreshold stable limit cycle (red dashed line) and the subthreshold stable limit cycle (magenta dashed line) corresponding to u = –0.8513 plotted in one figure; “►” represents the peak of the spike within burst before the pulse stimulation and clockwise direction of the trajectory, “●” represents the application phase of the pulse, and “■” represents the first peak after the recovery of bursting.
Fig. 4. A novel bursting pattern and the corresponding fast/slow variable dissection of the modified-FHN model with excitatory autapse when g = 0.02 and τ = 3.75: (a) The new bursting pattern (lower solid black line) induced by excitatory autaptic current (upper solid black line) acted on the period-8 bursting (dotted blue line); (b) projection of the new pattern (from ► to ■ in panel (a)) on phase plane (w , V ); at the phase ●, the trajectory of the new pattern (from ► to ■ in panel (a)) jumps into the subthreshold stable limit cycle (dashed magenta line) from suprathreshold stable limit cycle (dashed red line); (c) the projection of the trajectory of the novel bursting pattern (from ► to in panel (a)) on the plane (u , V ); (d) the panel (c) and the bifurcation of the fast subsystem Fig. 1(b) plotted in one figure.
Fig. 5. A new bursting pattern and the corresponding fast/slow variable dissection of the modified-FHN model with excitatory autapse when g = 0.02 and τ = 12.6: (a) The new bursting pattern (lower solid black line) induced by excitatory autaptic current (upper solid black line) acted on the period-8 bursting (dotted blue line); (b) projection of the trajectory of the new pattern (from ► to ■ in panel (a)) on phase plane (w , V ); at the phase ●, the trajectory of the new pattern (from ► to ■ panel (a)) jumps into the subthreshold stable limit cycle (dashed magenta line) from suprathreshold stable limit cycle (dashed red line); (c) the projection of the trajectory of the novel bursting pattern (from ► to ■ in panel (a)) is plotted on the plane (u , V ); (d) the panel (c) and the bifurcation of the fast subsystem Fig. 1(b) plotted in one figure.
Fig. 6. A new bursting pattern and the corresponding fast/slow variable dissection of the modified-FHN model with excitatory autapse when g = 0.02 and τ = 20.65: (a) The new bursting pattern (lower solid black line) is induced by excitatory autaptic current (upper solid black line) acted on the period-8 bursting (dotted blue line); (b) projection of the trajectory of the new pattern (from ► to ■ in panel (a)) on phase plane (w , V ); at the phase ●, the trajectory of the new pattern (from ► to ■ in panel (a)) jumps into the subthreshold stable limit cycle (dashed magenta line) from suprathreshold stable limit cycle (dashed red line); (c) the projection of the trajectory of the novel bursting pattern (from ► to ■ in panel (a)) is plotted on the plane (u , V ); (d) the panel (c) and the bifurcation of the fast subsystem Fig. 1(b) and plotted in one figure.
Fig. 7. A new bursting pattern and the corresponding fast/slow variable dissection of the modified-FHN model with excitatory autapse when g = 0.02 and τ = 70.6: (a) The new bursting pattern (lower solid black line) induced by excitatory autaptic current (upper solid black line) acted on the period-8 bursting (dotted blue line); (b) the projection of the trajectory of the new pattern (from ► to ■ in panel (a)) on phase plane (w , V ) under the action of autapse; The nearly unchanged spike induced by the 1st excitatory autaptic current pulse acting on phase ●1 within the spike; The expected subthreshold oscillation changes to suprathreshold firing induced by the 2nd excitatory autaptic current pulse acting on phase ●2; (c) the projection of the trajectory of the novel bursting pattern is plotted on the plane (u , V ); (d) the panel (c), original period-8 bursting (blue dotted line), and bifurcations of the fast subsystem Fig. 1(b) plotted in one figure.
Fig. 8. Changes of the average firing frequency with increasing different parameter values: (a) With increasing τ values when g is fixed at g = 0 (solid black line), g = 0.02 (dotted blue line), g = 0.07 (asterisk green line); (b) with increasing g when τ is fixed at τ = 3 (solid blue line), τ = 4 (dotted green line), and τ = 5 (dash-dot red line); the solid black line represents f 0 = 0.0567.
Fig. 9. Distribution of the average firing frequency on the (τ , g )-plane of the modified-FHN model with excitatory autapse. (a) The average firing frequency. Color scale represents the value of firing frequency. (b) The difference between the average firing frequency and f 0 = 0.0567. Black area: average frequency is lower than f 0 = 0.0567; white area: average frequency is higher than f 0 = 0.0567. The green, magenta, and blue solid cycles correspond to Fig. 4 (τ = 3.75, g = 0.02), Fig. 5 (τ = 12.6, g = 0.02), and Fig. 6 (τ = 20.65, g = 0.02), and the red solid cycle corresponds to Fig. 7 (τ = 70.6, g = 0.02).
| |||||||||||||||||||||||
Table 1. Main differences between this paper and Ref. [21] (excitatory autapse).

Set citation alerts for the article
Please enter your email address
© Copyright 2018-2021 | Chinese Laser Press. All Rights Reserved 沪ICP备15018463号-20