• High Power Laser Science and Engineering
  • Vol. 11, Issue 1, 010000e1 (2023)
Liya Shen1、2、3, Yanyan Li1、*, Wenkai Li1, Jiajun Song1, Junyu Qian1、3, Jianyu Sun1、3, Renyu Feng1、3, Yujie Peng1、*, and Yuxin Leng1、2、3、*
Author Affiliations
  • 1State Key Laboratory of High Field Laser Physics, Shanghai Institute of Optics and Fine Mechanics, Chinese Academy of Sciences, Shanghai, China
  • 2School of Physical Science and Technology, ShanghaiTech University, Shanghai, China
  • 3Center of Materials Science and Optoelectronics Engineering, University of Chinese Academy of Sciences, Beijing, China
  • show less
    DOI: 10.1017/hpl.2022.39 Cite this Article Set citation alerts
    Liya Shen, Yanyan Li, Wenkai Li, Jiajun Song, Junyu Qian, Jianyu Sun, Renyu Feng, Yujie Peng, Yuxin Leng. High temporal contrast 1053 nm laser source based on optical parametric amplification and second-harmonic generation[J]. High Power Laser Science and Engineering, 2023, 11(1): 010000e1 Copy Citation Text show less
    (a) Scheme of the 1053 nm laser source. PBS: polarization beam splitter; L: lens; NDF: neutral density filter; NOPA: noncollinear OPA. The linewidth indicates the beam size roughly and the shade indicates the pulse energy. (b) Schematic of the NOPA, where the angle between the signal and the pump is less than 0.7°.
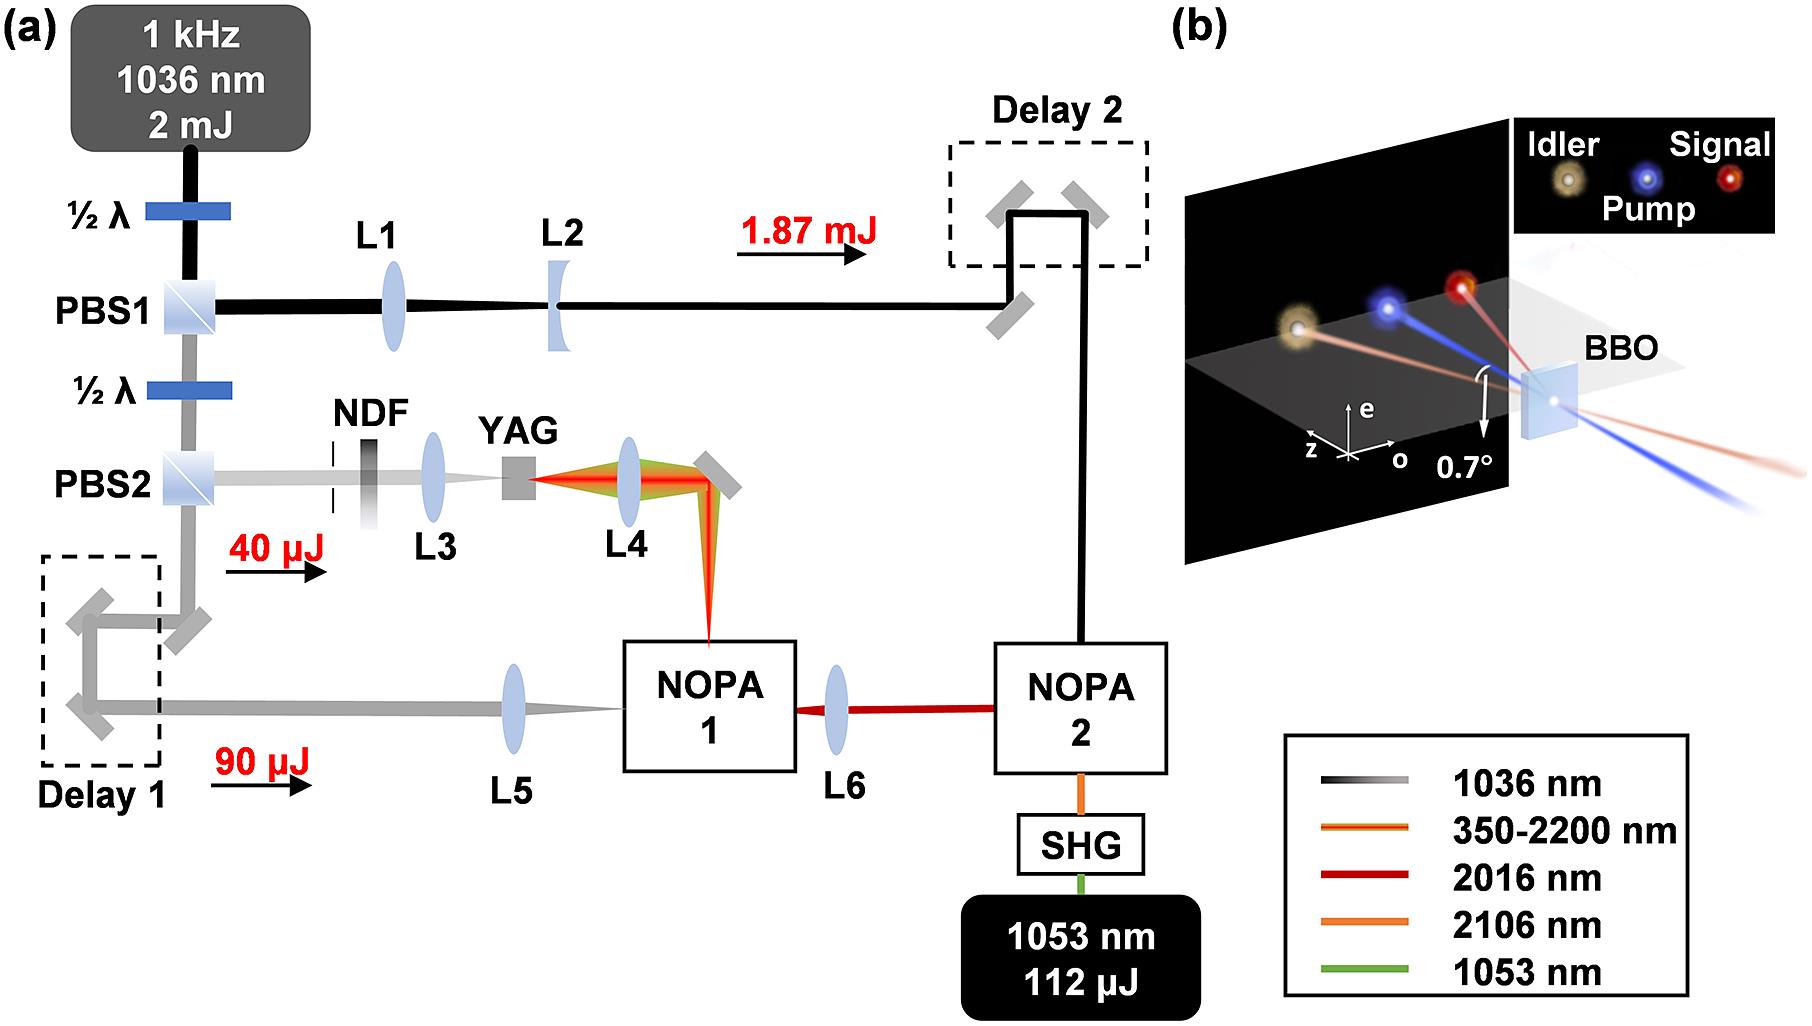
    Fig. 1. (a) Scheme of the 1053 nm laser source. PBS: polarization beam splitter; L: lens; NDF: neutral density filter; NOPA: noncollinear OPA. The linewidth indicates the beam size roughly and the shade indicates the pulse energy. (b) Schematic of the NOPA, where the angle between the signal and the pump is less than 0.7°.
    (a) Spectra of NOPA2 output. The orange area is the amplified signal pulse and the green area is the idler pulse of NOPA2. The orange dashed line (simulated signal) and green dotted line (simulated idler) are the simulated spectra. The red area of the inset is the spectrum of the white light generated by YAG, and the jitter before 500 nm (gray area) may be caused by stray light of the spectrometer. The blue line of the inset is the amplified signal pulse of NOPA1. (b) Spectra of second-harmonic generation of the idler from NOPA2. The spectra fluctuate in the red area, and the middle solid line is the average value.
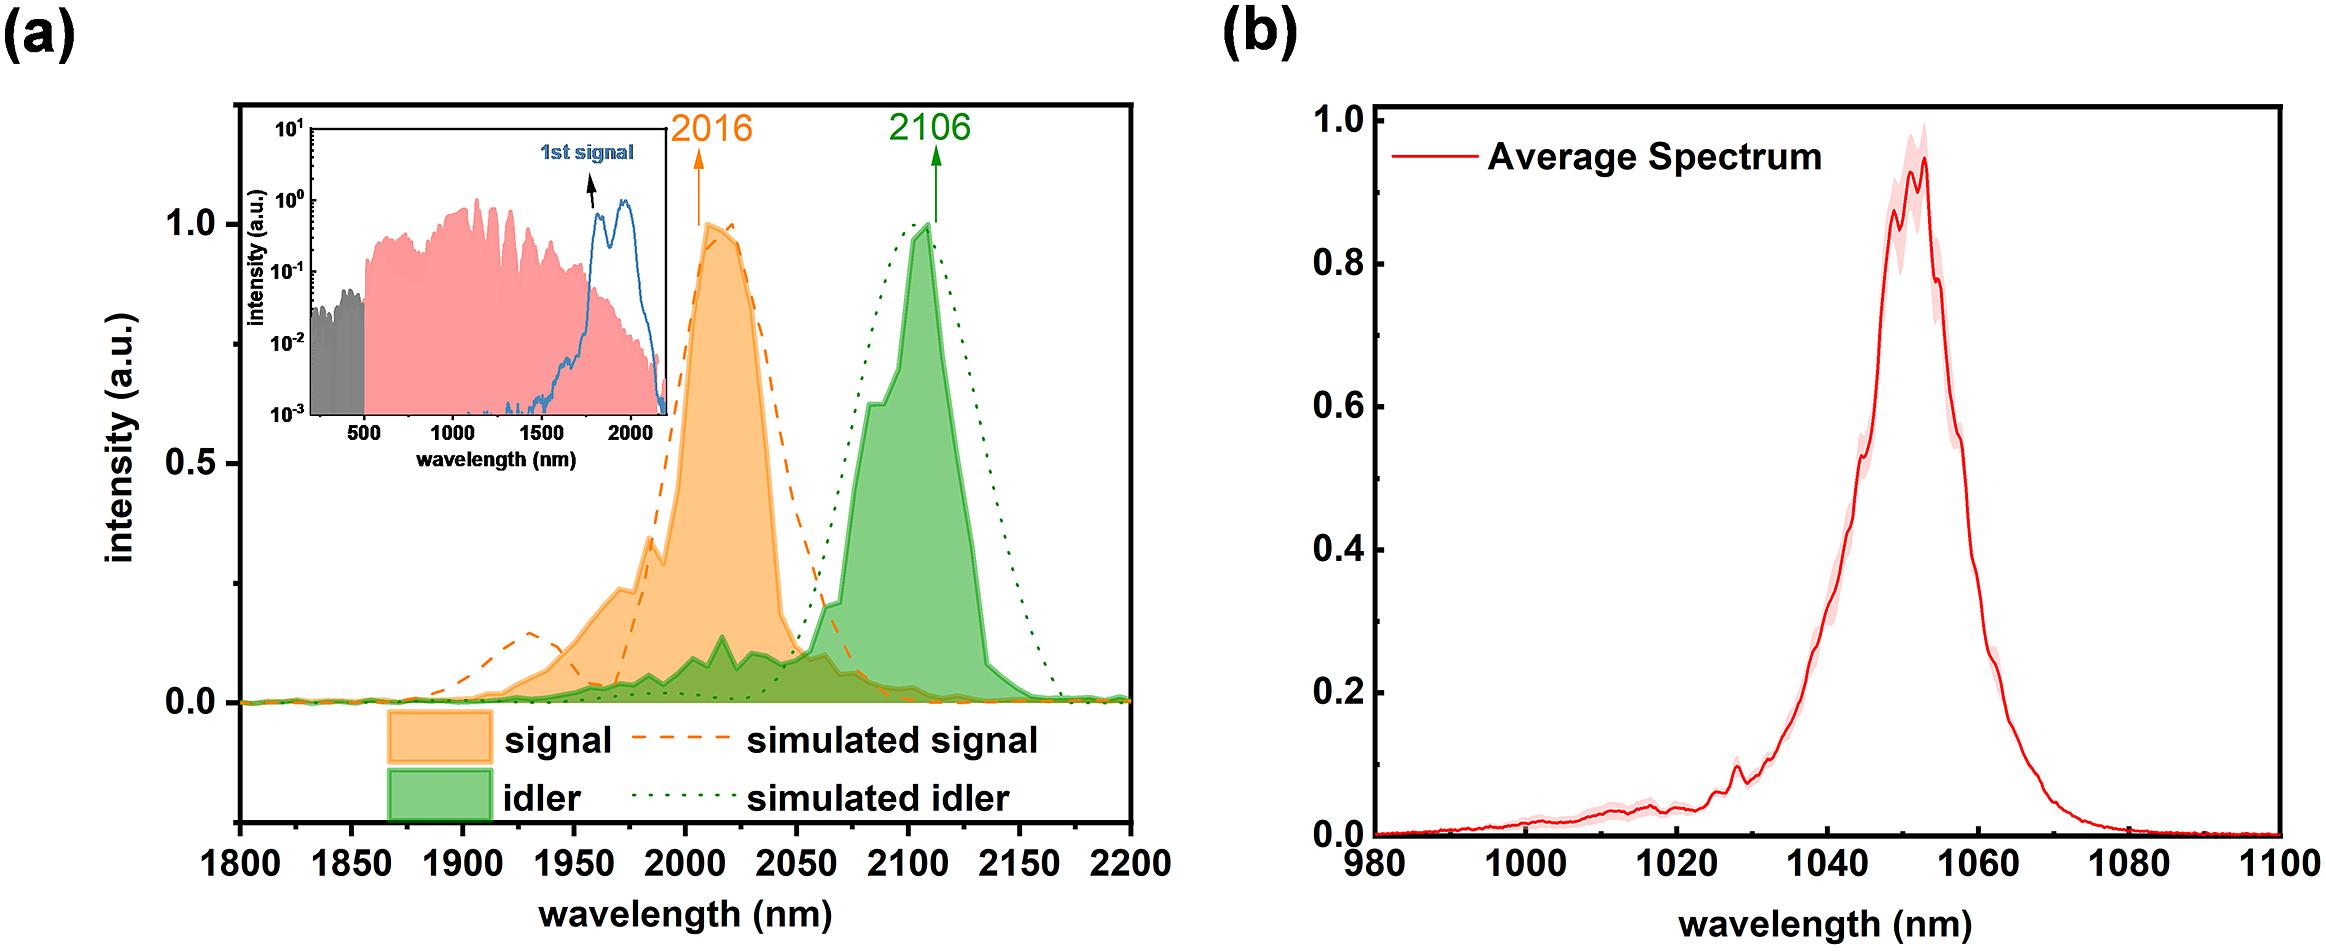
    Fig. 2. (a) Spectra of NOPA2 output. The orange area is the amplified signal pulse and the green area is the idler pulse of NOPA2. The orange dashed line (simulated signal) and green dotted line (simulated idler) are the simulated spectra. The red area of the inset is the spectrum of the white light generated by YAG, and the jitter before 500 nm (gray area) may be caused by stray light of the spectrometer. The blue line of the inset is the amplified signal pulse of NOPA1. (b) Spectra of second-harmonic generation of the idler from NOPA2. The spectra fluctuate in the red area, and the middle solid line is the average value.
    Pulse width of the output 1053 nm. (a) Measured FROG trace. (b) Retrieved FROG trace. (c) Retrieved spectral intensity (blue solid line), spectral phase (orange), and actual spectrum of 1053 nm (blue dashed line). (d) Retrieved temporal intensity (blue solid line), retrieved temporal phase (orange) and Fourier transform-limited pulse (blue dashed line). The grid sizes are 256 × 256.
    Fig. 3. Pulse width of the output 1053 nm. (a) Measured FROG trace. (b) Retrieved FROG trace. (c) Retrieved spectral intensity (blue solid line), spectral phase (orange), and actual spectrum of 1053 nm (blue dashed line). (d) Retrieved temporal intensity (blue solid line), retrieved temporal phase (orange) and Fourier transform-limited pulse (blue dashed line). The grid sizes are 256 × 256.
    (a) Temporal contrast of the initial 1030 nm (red line) and output 1053 nm (black line) pulses. The blue box indicates the noise level. (b) Details of the temporal contrast of the initial 1030 nm (red line) and output 1053 nm laser pulses (black line) at ±40 ps time.
    Fig. 4. (a) Temporal contrast of the initial 1030 nm (red line) and output 1053 nm (black line) pulses. The blue box indicates the noise level. (b) Details of the temporal contrast of the initial 1030 nm (red line) and output 1053 nm laser pulses (black line) at ±40 ps time.
    The quality of the output 1053 nm beam. (a) The beam pointing stability. (b) The M2 quality of the output laser beam. (c) The power stability.
    Fig. 5. The quality of the output 1053 nm beam. (a) The beam pointing stability. (b) The M2 quality of the output laser beam. (c) The power stability.
    Liya Shen, Yanyan Li, Wenkai Li, Jiajun Song, Junyu Qian, Jianyu Sun, Renyu Feng, Yujie Peng, Yuxin Leng. High temporal contrast 1053 nm laser source based on optical parametric amplification and second-harmonic generation[J]. High Power Laser Science and Engineering, 2023, 11(1): 010000e1
    Download Citation