• Photonics Research
  • Vol. 6, Issue 9, 887 (2018)
Yixiao Gao1、*, Ning Zhou1, Zhangxing Shi1, Xin Guo1, and Limin Tong1、2、3
Author Affiliations
  • 1State Key Laboratory of Modern Optical Instrumentation, College of Optical Science and Engineering, Zhejiang University, Hangzhou 310027, China
  • 2Collaborative Innovation Center of Extreme Optics, Shanxi University, Taiyuan 030006, China
  • 3e-mail: phytong@zju.edu.cn
  • show less
    DOI: 10.1364/PRJ.6.000887 Cite this Article Set citation alerts
    Yixiao Gao, Ning Zhou, Zhangxing Shi, Xin Guo, Limin Tong. Dark dimer mode excitation and strong coupling with a nanorod dipole[J]. Photonics Research, 2018, 6(9): 887 Copy Citation Text show less
    Au nanorod dimer excitation with an electric dipole. (a) Mode profile and surface charge distribution of a longitudinal dipole mode in a single Au nanorod and hybridized bright and dark modes in a nanorod dimer; (b) resonant wavelengths of bright and dark modes as a function of dimer spacing d. The yellow dashed line denotes the resonant wavelength of a dipole mode in a single rod. The length and diameter of each nanorod are 95 and 20 nm, respectively. (c) Absorption spectra of the Au nanorod dimer under different electric dipole excitation conditions. The dimer spacing d is 10 nm. The electric dipole is located 20 nm away from the Au nanorod dimer. The red arrow indicates the electric dipole moment orientation and position relative to the nanorod dimer. The bright and dark modes are located at the wavelengths of 791.0 and 704.3 nm, respectively.
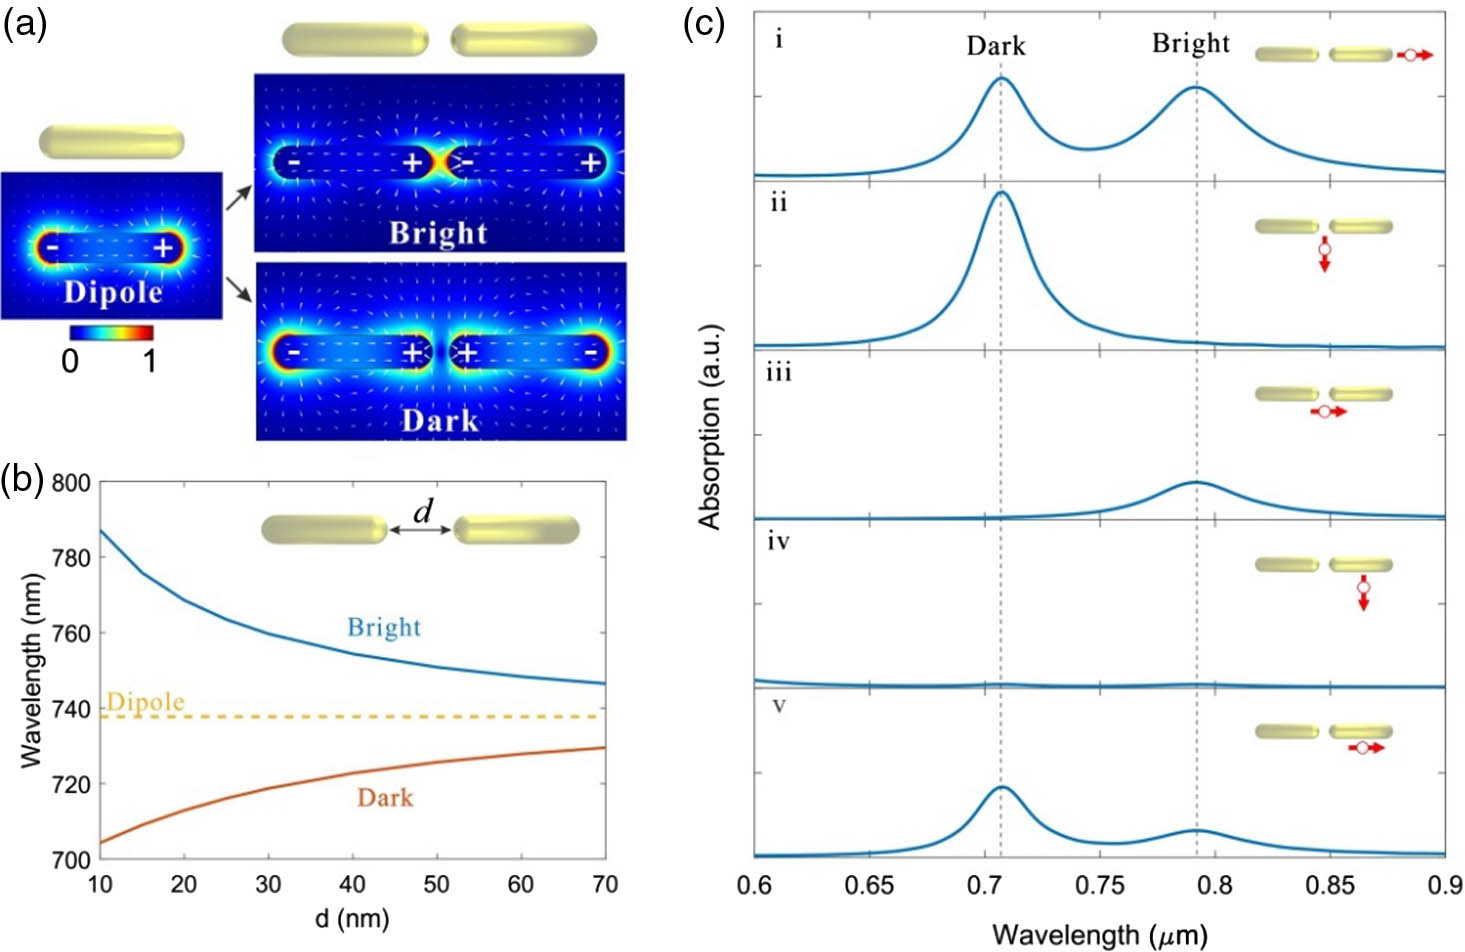
    Fig. 1. Au nanorod dimer excitation with an electric dipole. (a) Mode profile and surface charge distribution of a longitudinal dipole mode in a single Au nanorod and hybridized bright and dark modes in a nanorod dimer; (b) resonant wavelengths of bright and dark modes as a function of dimer spacing d. The yellow dashed line denotes the resonant wavelength of a dipole mode in a single rod. The length and diameter of each nanorod are 95 and 20 nm, respectively. (c) Absorption spectra of the Au nanorod dimer under different electric dipole excitation conditions. The dimer spacing d is 10 nm. The electric dipole is located 20 nm away from the Au nanorod dimer. The red arrow indicates the electric dipole moment orientation and position relative to the nanorod dimer. The bright and dark modes are located at the wavelengths of 791.0 and 704.3 nm, respectively.
    (a) Schematic of plasmonic strong coupling in an Au nanorod structure. A single nanorod is placed along the middle line of the nanorod dimer with a separation of h, as denoted in the inset. A normally incident plane wave with a wave vector k is linearly polarized along the axis of a single nanorod. (b) Absorption spectra of the dipole mode in a single nanorod (blue) and dark mode in a nanorod dimer (red). The rod length and spacing of the dimer are 95 and 30 nm, respectively. The length of the single nanorod is 90.4 nm. The diameter of all nanorods is 20 nm.
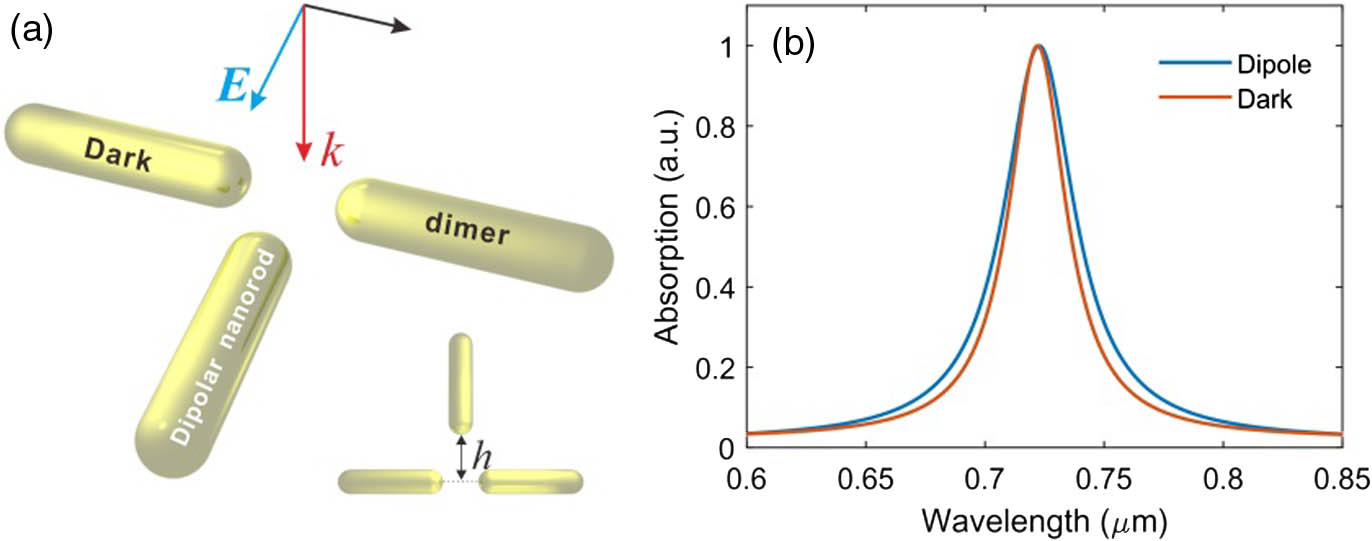
    Fig. 2. (a) Schematic of plasmonic strong coupling in an Au nanorod structure. A single nanorod is placed along the middle line of the nanorod dimer with a separation of h, as denoted in the inset. A normally incident plane wave with a wave vector k is linearly polarized along the axis of a single nanorod. (b) Absorption spectra of the dipole mode in a single nanorod (blue) and dark mode in a nanorod dimer (red). The rod length and spacing of the dimer are 95 and 30 nm, respectively. The length of the single nanorod is 90.4 nm. The diameter of all nanorods is 20 nm.
    (a) Scattering spectral splitting of the coupled nanorods with different coupling distance. The dashed curve shows the scattering of an individual dipolar nanorod. Electric field profiles of the coupled nanorods with a coupling distance h=10 nm at 686.2 and 780.9 nm. Plus and minus signs denote the surface charge distribution. (b) The dependence of spectral splitting on the coupling distance h.
    Fig. 3. (a) Scattering spectral splitting of the coupled nanorods with different coupling distance. The dashed curve shows the scattering of an individual dipolar nanorod. Electric field profiles of the coupled nanorods with a coupling distance h=10  nm at 686.2 and 780.9 nm. Plus and minus signs denote the surface charge distribution. (b) The dependence of spectral splitting on the coupling distance h.
    Scattering spectra of the coupled nanorods with varying dipole resonator length Lb. The white and red dashed lines correspond to an unperturbed dark dimer mode and the dipole mode. The saturated scattering intensity on the upper-right corner is provided intentionally to get better contrast for the lower scattering branch due to a much larger scattering of the dipolar nanorod with longer Lb.
    Fig. 4. Scattering spectra of the coupled nanorods with varying dipole resonator length Lb. The white and red dashed lines correspond to an unperturbed dark dimer mode and the dipole mode. The saturated scattering intensity on the upper-right corner is provided intentionally to get better contrast for the lower scattering branch due to a much larger scattering of the dipolar nanorod with longer Lb.
    Coherent energy exchange between the dipole mode and the dark dimer mode. (a) Complete energy exchange within the strong coupling regime, (b) partial energy exchange with a detuned frequency between the dipole and the dark dimer modes, (c) energy exchange with a lower exchange rate in the weakly coupled dipole and dark dimer modes. Time-dependent electric field amplitudes near the dipolar nanorod and the dark dimer are measured at the corresponding colored spots denoted in the inset of (a), which are 1 nm away from the rod end. The parameters of coupled nanorods are the same as in Fig. 3, except Lb and h.
    Fig. 5. Coherent energy exchange between the dipole mode and the dark dimer mode. (a) Complete energy exchange within the strong coupling regime, (b) partial energy exchange with a detuned frequency between the dipole and the dark dimer modes, (c) energy exchange with a lower exchange rate in the weakly coupled dipole and dark dimer modes. Time-dependent electric field amplitudes near the dipolar nanorod and the dark dimer are measured at the corresponding colored spots denoted in the inset of (a), which are 1 nm away from the rod end. The parameters of coupled nanorods are the same as in Fig. 3, except Lb and h.
    Yixiao Gao, Ning Zhou, Zhangxing Shi, Xin Guo, Limin Tong. Dark dimer mode excitation and strong coupling with a nanorod dipole[J]. Photonics Research, 2018, 6(9): 887
    Download Citation