• Journal of Geo-information Science
  • Vol. 22, Issue 5, 1023 (2020)
Jieer RUAN1、1、2、2, Yingbiao CHEN1、1、2、2、*, Qinglan QIAN1、1, and Zhiwei YANG1、1、2、2
Author Affiliations
  • 1.广州大学地理科学学院,广州 510006
  • 1School of Geographical Sciences, Guangzhou University, Guangzhou 510006, China
  • 2.广东省地理国情监测与综合分析工程技术研究中心,广州 510006
  • 2Guangdong provincial geographical condition monitoring and comprehensive analysis engineering technology research center, Guangzhou 510006, China
  • show less
    DOI: 10.12082/dqxxkx.2020.190498 Cite this Article
    Jieer RUAN, Yingbiao CHEN, Qinglan QIAN, Zhiwei YANG. A Multidimensional Analysis of Economic Spatial Pattern of Pearl River Delta Urban Agglomeration under the Influence of High-Speed Railway[J]. Journal of Geo-information Science, 2020, 22(5): 1023 Copy Citation Text show less
    Location diagram of Pearl River Delta urban agglomeration
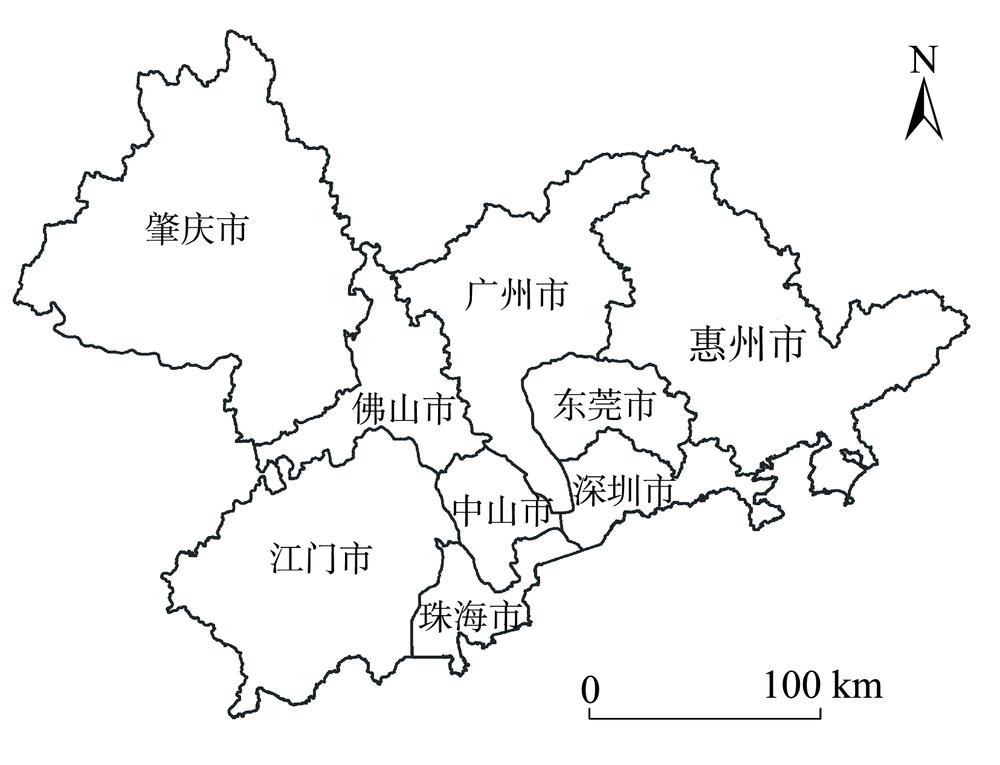
    Fig. 1. Location diagram of Pearl River Delta urban agglomeration
    Spatial distribution of the total economic links between citiesin the Pearl River Delta urban agglomeration in 2010, 2014 and 2018
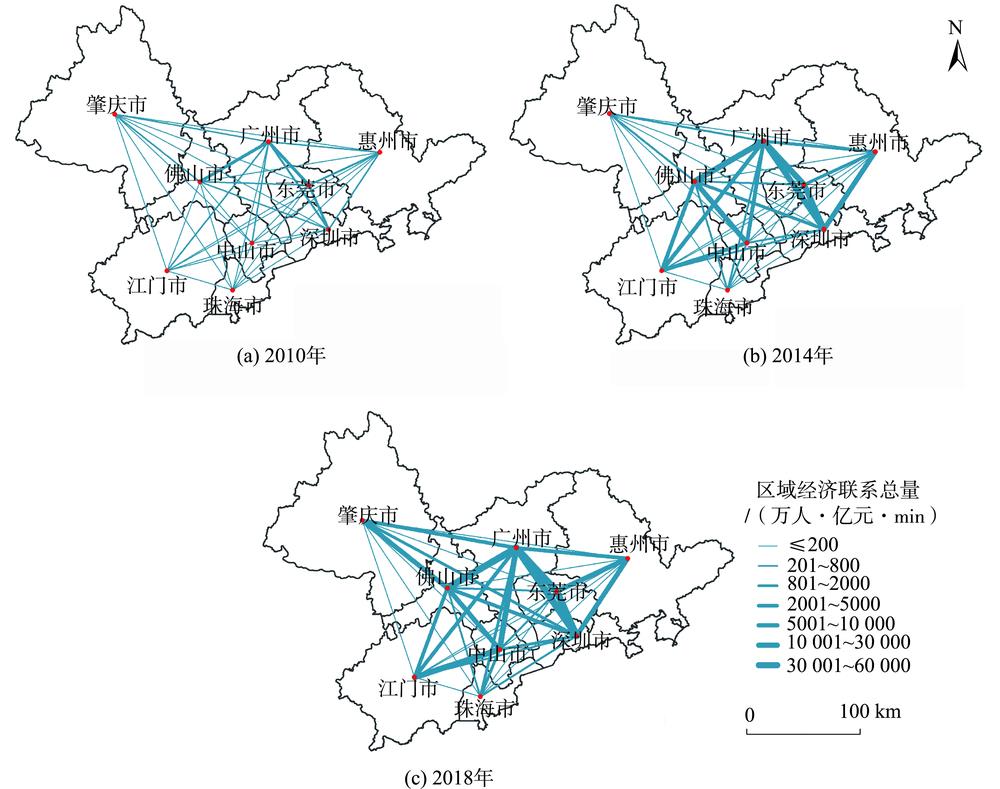
    Fig. 2. Spatial distribution of the total economic links between citiesin the Pearl River Delta urban agglomeration in 2010, 2014 and 2018
    Analysis of regional advantage potential time series of the Pearl River Delta urban agglomeration in 2010, 2014 and 2018
    Fig. 3. Analysis of regional advantage potential time series of the Pearl River Delta urban agglomeration in 2010, 2014 and 2018
    Spatial distribution of the regional advantage potentialin the Pearl River Delta urban agglomeration in 2010, 2014 and 2018
    Fig. 4. Spatial distribution of the regional advantage potentialin the Pearl River Delta urban agglomeration in 2010, 2014 and 2018
    Time series analysis of regional economic differences of Pearl River Delta urban agglomeration in 2010, 2014 and 2018
    Fig. 5. Time series analysis of regional economic differences of Pearl River Delta urban agglomeration in 2010, 2014 and 2018
    城市组广州东莞深圳佛山肇庆惠州中山珠海江门
    广州25.8888.1021.0713.5647.0587.7758.8973.62
    东莞25.8897.058.3111.7712.1112.5714.219.71
    深圳88.1097.0538.5614.6587.8036.1420.2122.32
    佛山21.078.3138.5611.4011.74145.6049.7599.72
    肇庆13.5611.7714.6511.4018.3913.3513.7411.17
    惠州47.0512.1187.8011.7418.3917.2015.628.61
    中山87.7712.5736.14145.6013.3517.2056.01128.83
    珠海58.8914.2120.2149.7513.7415.6256.014.33
    江门73.629.7122.3299.7211.178.61128.834.33
    Table 1. The annual growth rate of total economic links between cities in the Pearl River Delta urban agglomeration from 2010 to 2014 (%)
    城市组广州东莞深圳佛山肇庆惠州中山珠海江门
    广州10.4013.6010.3878.5310.0638.3618.7910.44
    东莞10.4012.249.0629.4346.958.0712.379.12
    深圳13.6012.2437.4385.5111.8915.7428.3512.27
    佛山10.389.0637.4396.4522.368.0512.359.09
    肇庆78.5329.4385.5196.456.7339.6535.087.10
    惠州10.0646.9511.8922.366.7319.9924.418.78
    中山38.368.0715.748.0539.6519.9921.5723.92
    珠海18.7912.3728.3512.3535.0824.4121.5717.28
    江门10.449.1212.279.097.108.7823.9217.28
    Table 2. The annual growth rate of total economic links between cities in the Pearl River Delta urban agglomeration from 2014 to 2018 (%)
    Jieer RUAN, Yingbiao CHEN, Qinglan QIAN, Zhiwei YANG. A Multidimensional Analysis of Economic Spatial Pattern of Pearl River Delta Urban Agglomeration under the Influence of High-Speed Railway[J]. Journal of Geo-information Science, 2020, 22(5): 1023
    Download Citation