In order to solve the problem of direction discrimination and low-speed measurement for a spatial filtering velocimeter, a method of frequency shifting is put forward. The filtering device is constructed by a CMOS linear image sensor that is employed both as a differential spatiotemporal filter and as a photodetector. Frequency shifting is realized by shifting the pixels of the image sensor, and the shifting is implemented digitally. The power spectrum of the output signal is obtained by fast Fourier transform (FFT). Given the limited resolution of FFT, a frequency spectrum correction algorithm, called energy centrobaric correction, is utilized to improve the frequency resolution. The built system is used to measure the transverse velocity of a simple pendulum. The results of theory analysis and experiments verify the feasibility of direction discrimination and low-speed measurement by the method of frequency shifting. Experimental results also show that the method of energy centrobaric correction can improve the velocity resolution by more than one order of magnitude.
The spatial filtering velocimeter (SFV) has many important advantages, such as noncontact measurement, high precision, a wide range of velocity measurements, and a short response time. Since it was proposed by Ator[1], the SFV has been widely applied to velocity measurement of surfaces[2–5], particles[6,7], and two-phase flow[8,9]. Based on the spatial filtering effect, the SFV utilizes the fact that scattering rays modulated by a spatial filter carry a signal whose frequency is proportional to the velocity of the scattering object. However, light rays scattered by objects moving in two opposite directions carry signals with the same frequency, which leads to directional ambiguity in the SFV. Furthermore, the output signal always consists of a periodic component containing information about the velocity and a lower frequency component called the pedestal. The pedestal is generally removed by using an electric high-pass filter since the pedestal consists of components with dc and lower frequencies than the signal frequency. However, the high-pass filter brings trouble to the low-speed measurement when the signal frequency is very close to the dc component.
In order to eliminate directional ambiguity and to realize low-speed measurement, several attempts have been proposed and are based on a frequency shifting technique, which mainly includes the use of a rotating disk grating or cylinder grating and amplitude modulation[10]. However, the rotating grating brings in a mechanically unstable element. The amplitude modulation approach proposed by Itakura[11] was realized by periodically changing the voltage applied to a liquid crystal cell array, whose transmittance distribution is time varying according to the voltage supplied. The disadvantages of the liquid crystal cell array are its relatively poor frequency response and optical properties that are sensitive to a temperature change. It is also not able to eliminate the impact of the frequency shifting on the power spectrum of the output signal.
In this Letter, a new method of frequency shifting is proposed to eliminate directional ambiguity and to realize low-speed measurement. This method is based on pixel shifting of a CMOS linear image sensor that is employed both as a differential spatial filter and as a photodetector. This method is used to measure the transverse velocity of a simple pendulum. Measurement of the motion of a conveyor belt driven by a high-precision rotary table is done to check the measurement accuracy of the system for low-speed measurement. The experimental results verify the usefulness of the proposed method.
Sign up for Chinese Optics Letters TOC. Get the latest issue of Chinese Optics Letters delivered right to you!Sign up now
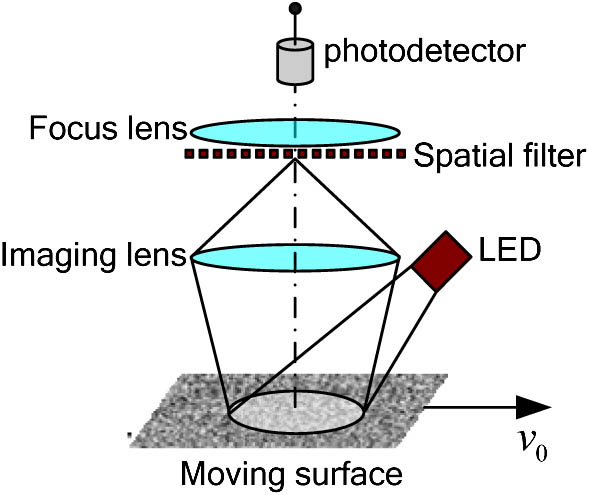
The schematic diagram for the basic principle of a SFV is given by Fig. 1. A moving object with a velocity of is illuminated. The illumination is scattered by the object surface, which is imaged onto the spatial filter by an object lens. The spatial filter usually consists of a set of parallel slits, vertical to the moving direction of the object, as shown in Fig. 1. The spatial filter transforms the velocity information of the object image into periodic light intensity, which is focused by a focus lens into a photodetector. The photodetector transforms the light intensity into a temporal signal having a frequency proportional to the object velocity . The relationship between the signal frequency and the velocity can be defined as where is the optical magnification of the object lens and is the spatial period of the filter. Then the velocity can be obtained after the light intensity frequency is calculated.
Instead of a set of parallel slits, a CMOS linear image sensor was used here both as a spatial filter and a photodetector. As shown in Fig. 2, the pixels denoted by white strips and green strips consist of a spatial filter, respectively. By a subtraction operation, which is realized in a field-programmable gate array (FPGA), a differential signal with the pedestal-component eliminated is obtained. A spatial filter with this structure is called a differential spatial filter. By continuously shifting the gird structure over a cycle of frames, a shifting frequency can be obtained as follows: where is the frame rate of the CMOS, and is the number of grids or pixels that are shifted between two temporally neighboring frames. Figure 2 schematically shows how the method of frequency shifting works. For simplicity, and is used.
Figure 2.Principle of frequency shifting based on a linear CMOS image sensor.
Therefore, with frequency shifting, under the condition , Eq. (1) is deduced as where is the detected signal frequency by the system and is the corresponding frequency generated by under the condition that frequency shifting is not applied. From Eq. (3) it can be obtained that where if is bigger than then has a negative sign, and if is smaller than then has a positive sign. A negative indicates that the direction of image velocity is opposite to the shifting direction, and vice versa. As a result, the direction of motion can be discriminated by checking the sign of ().
Figure 3 shows schematically the configuration of the SFV for direction discrimination and low-speed measurement based on a CMOS linear image sensor. The most appropriate measured object for this experiment should be a simple pendulum, which is made of a string and a plank. The plank is illuminated by a LED and projected onto the CMOS by a convex lens. The convex lens has an aperture and a focal length of 40 mm and 75 mm, respectively, and is 190 mm away from the plank. The CMOS is placed horizontally, so the horizontal component of the moving velocity of the plank can be detected. Work requirements for the CMOS are satisfied by an electronic circuit and the timing requirements such as a driving clock, spatial filtering operation, and frequency shifting are provided by a FPGA. The output of the CMOS is digitized by an 8-bit A/D converter and then is transferred to a two-port RAM in a FPGA for spatial filtering operations. After that, a differential signal incorporating a shifting frequency with pedestal components eliminated is obtained and is transferred to a personal computer for signal processing.
The signal processing technique is based on frequency spectrum analysis. The algorithm was completely written by the graphical programming language LabVIEW. The power spectrum of the output signal is obtained by fast Fourier transform (FFT) with a Hanning window. The position of the main peak in the power spectrum is a measure of the dominant frequency in the signal. Then the power spectrum is corrected by a frequency spectrum correction algorithm called energy centrobaric correction[12] to obtain a more accurate frequency value to solve the problem of a limited frequency resolution of the FFT. The energy centrobaric correction is realized by the following steps. First, find the peak frequency bin in the power spectrum. Second, find the two neighboring frequency bins of the peak. Last, calculate the centrobaric of the three frequency bins and make it as the corrected frequency bin. On one hand, the signal frequency obtained by frequency spectrum correction is used to calculate the velocity. On the other hand, the detected frequency is compared with the shifting frequency , and the moving direction is obtained by checking the sign of ().
Experiments were performed in order to check the ability of the method of frequency shifting to realize direction discrimination and low-speed measurement. The simple pendulum was given an initial velocity and then swung freely. Its transverse velocities were detected by the SFV with frequency shifting. Experimental results for 120 s are shown in Fig. 4(a) and Fig. 4(b) shows the details of the first 20 s. It can be seen from Fig. 4(b) that the simple pendulum was doing a quasi-sinusoidal motion with an attenuated amplitude and was changing its motion direction frequently. Apparently, the last half of Fig. 4(a) illustrates that the velocity amplitude is somewhat modulated. This may be caused by the out-of-plane motion of the plank, and when the in-plane swing slowed down, this out-of-plane motion became remarkable. This experiment verified that the system could sense the motion of a simple pendulum bidirectionally.
Figure 4.Experimental results of direction discrimination and low-speed measurement.
Figure 4 also shows some experimental data near zero. Further experiment was conducted to examine the low boundary of the measurable velocity and the velocity resolution for this system. In this experiment, two methods were employed to calculate the velocity and the results were compared. The results are shown in Fig. 5. Velocities in Fig. 5(a) were calculated by selecting the peak of the power spectrum obtained by FFT, while velocities in Fig. 5(b) were calculated by FFT and the frequency spectrum correction, called energy centrobaric correction. Fig. 5(a) indicates that the low boundary of the measurable velocity and the velocity resolution obtained by FFT is between 0.010 and 0.015 m/s. This value can be reduced by increasing , the number of data for FFT, or by reducing , the sampling rate of the signal, since the frequency resolution is determined by . In this system and , so the calculated velocity resolution is 0.0123 m/s, which agrees with the experiment results. With the frequency spectrum correction, Fig. 5(b) shows that the system can sense the velocity of . Velocity fluctuations still can be seen in the last two seconds in Fig. 5(b). Therefore, with the energy centrobaric correction, the velocity resolution can be improved by more than one order of magnitude, and mm/s velocities can be detected.
Figure 5.Comparison of velocity calculations (a) without frequency spectrum correction and (b) with frequency spectrum correction.
Further experiments were conducted to check the performance of this method for low-speed measurement. Instead of a simple pendulum, a conveyor belt driven by a high precision rotary table having a rate stability better than was used as the velocity reference. The radius of the rotary table is 180 mm, so an angular velocity of 1 deg/s results in a linear velocity of . In this experiment, the angular velocity of the rotary table was set at 1 deg/s to examine the relative error of low-speed measurement. The test lasted for 1000 s and about 8000 measurement results were obtained. The relative error is calculated by where is the measurement frequency and is the mean value of all the measurement data. The relative error is shown in Fig. 6. By calculating the deviation of the the standard uncertainty for a 1 deg/s measurement is obtained as 0.068%.
In a SFV using a CMOS linear image sensor a new method of frequency shifting for eliminating directional ambiguity and for low-speed measurement is proposed and experimentally verified. In this method, the relation between the detected signal frequency and the shifting frequency reveals the motion direction. This method is found to be suitable for sensing the motion of a simple pendulum bidirectionally. What is more, by applying the energy centrobaric correction to the power spectrum obtained by FFT, the system is able to measure speeds as low as . The relative error for a 1 deg/s measurement is examined. The relative standard uncertainty turns out to be 0.068% for this 1000 s test. Therefore, the method of frequency shifting is useful for direction discrimination and low-speed measurement with favorable results.