
Xiuye Liu, Jianhua Zeng, "Gap solitons in parity–time symmetric moiré optical lattices," Photonics Res. 11, 196 (2023)
- Photonics Research
- Vol. 11, Issue 2, 196 (2023)
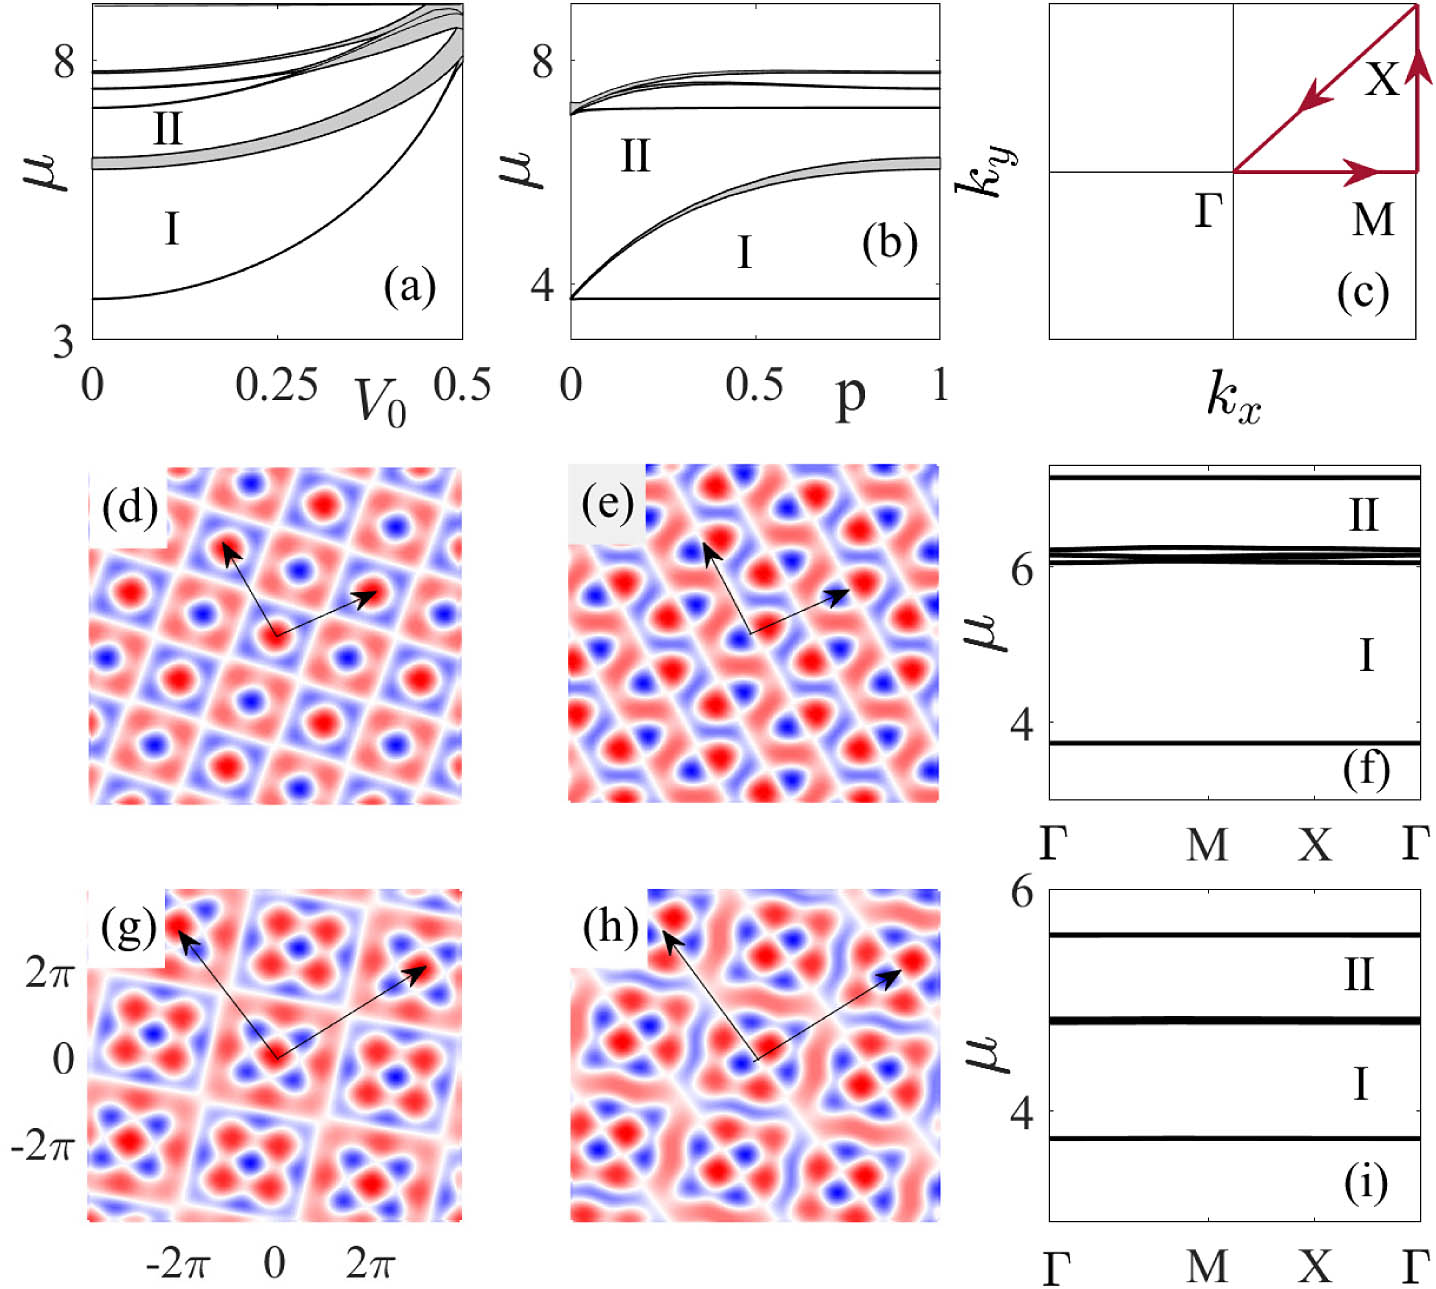
Fig. 1. Bandgap structures for 2D PT θ = arctan ( 3 / 4 ) V 0 p θ = arctan ( 3 / 4 ) θ = arctan ( 5 / 12 ) V 0 = 0.02 p = 1
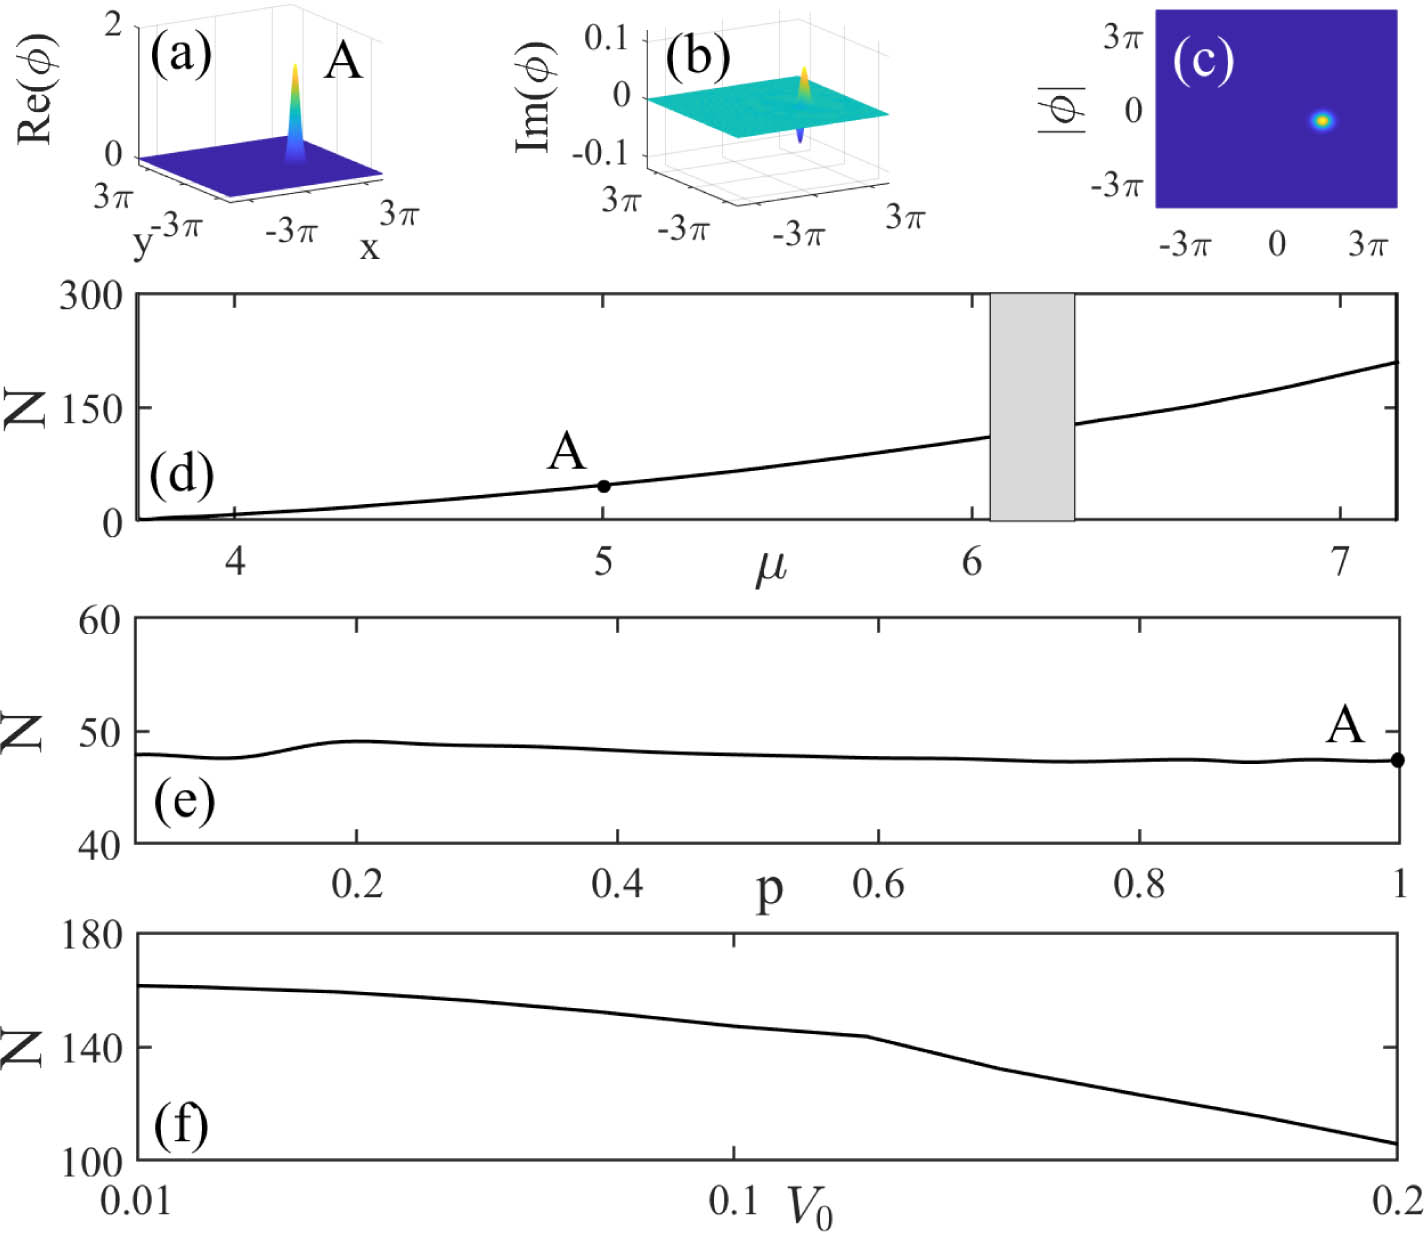
Fig. 2. Typical profile of a fundamental GS supported by the 2D PT θ = arctan ( 3 / 4 ) N μ p V 0 θ = arctan ( 3 / 4 ) μ = 5 N = 47.4 μ = 6.7
Fig. 3. Typical profiles of higher-order GSs grouped as two out-of-phase (a), (b) and in-phase (c), (d) fundamental GSs at θ = arctan ( 3 / 4 ) N μ θ = arctan ( 3 / 4 ) μ = 4.4 N = 43.9 μ = 4.6 N = 59.3
Fig. 4. Profiles of gap vortices consisting of four fundamental GSs with vortex charge S = 1 N μ θ = arctan ( 3 / 4 ) μ = 4.8 N = 153.5 μ = 6 N = 430
Fig. 5. Profiles of fundamental GSs (a), (b), higher-order GSs (c), (d), and gap vortices with S = 1 μ = 5 N = 47.4 μ = 6.29 N = 128.2 μ = 5.2 N = 114.7 μ = 6.28 N = 252.6 μ = 4.8 N = 153.5 μ = 6 N = 430
|
Table 1. Stability Regions (Characterized by μ


Set citation alerts for the article
Please enter your email address

© Copyright 2018-2021 | Chinese Laser Press. All Rights Reserved 沪ICP备15018463号-20