• Acta Geographica Sinica
  • Vol. 75, Issue 8, 1557 (2020)
Xiaolu GAO1、2、*, Danxian WU1、2, and Bingqiu YAN3
Author Affiliations
  • 1Key Laboratory of Regional Sustainable Development Modeling, Institute of Geographic Sciences and Natural Resources Research, CAS, Beijing 100101, China
  • 2University of Chinese Academy of Sciences, Beijing 100049, China
  • 3Beijing Opera Art's College, Beijing 100068, China
  • show less
    DOI: 10.11821/dlxb202008001 Cite this Article
    Xiaolu GAO, Danxian WU, Bingqiu YAN. Measure and distribution of urban elderly in poverty: An empirical study in Beijing[J]. Acta Geographica Sinica, 2020, 75(8): 1557 Copy Citation Text show less
    Estimations of poverty line by (a) poverty rate and (b) rank
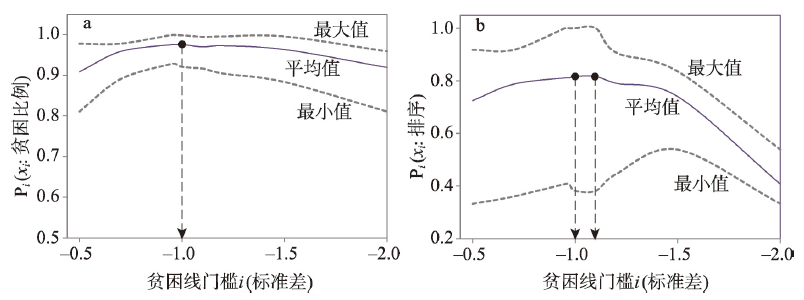
    Fig. 1. Estimations of poverty line by (a) poverty rate and (b) rank
    Distribution of the estimated ratio of poor urban older people in Beijing
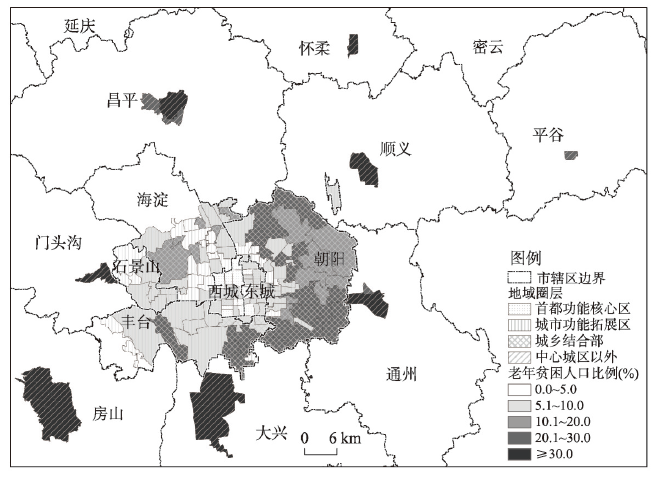
    Fig. 2. Distribution of the estimated ratio of poor urban older people in Beijing
    Distribution of the estimated density of poor urban older people in Beijing
    Fig. 3. Distribution of the estimated density of poor urban older people in Beijing
    变量定义有效样本(N = 619)
    样本数(个)比例(%)
    居住社区类型R1中心城区混合社区,西城区白纸坊街道里仁街10116.3
    R2廉租房社区,东城区东花市街道广渠门北里小区6210.0
    R3旧城四合院街坊社区,西城区什刹海街道9715.7
    R4单位大院,海淀区万寿路街道万寿路5号院8413.6
    R5经济适用房社区,昌平区回龙观街道龙腾苑6区9815.8
    R6普通商品房社区,朝阳区平房地区国美第一城小区9415.2
    R7县镇老旧社区,昌平区东小口镇小辛庄6610.7
    R8城乡混合社区,丰台区南苑地区大红门街道172.7
    年龄(岁)1< 6014423.3
    260~6416126.0
    365~698814.2
    470~7917027.5
    5≥ 80569.0
    性别123337.6
    238662.4
    教育程度1小学以下406.5
    2小学毕业27344.1
    3初中毕业17828.8
    4高中毕业6911.1
    5大专以上599.5
    人均可支配收入(元/月)1≤ 10008313.4
    21001~300025741.5
    33001~500020433.0
    45001~100006410.3
    5> 10000111.8
    住房面积(m2)最小值8
    中值70
    最大值1000
    健康支出(元/月)1≤ 10019130.9
    2101~30012219.7
    3301~50011919.2
    4501~100010116.3
    51001~30007812.6
    6> 300081.3
    身体健康1非常健康27444.3
    2基本健康29247.2
    3部分自理447.1
    4无法自理91.5
    精神健康1非常健康37660.7
    2基本健康23738.3
    3部分自理61.0
    4无法自理00.0
    居住安排*1独自生活6811.0
    2他人同住61.0
    3老人同住24840.1
    4子女同住29748.0
    Table 1. Descriptive statistics of the sample attributes in 8 communities in Beijing
    主成分矩阵旋转后的主成分因子
    12341.资源2.健康3.独立性4.性别
    固有值/分散2.0131.6461.2050.9001.7161.6941.2791.074
    百分比22.3618.2913.3810.0019.0718.8214.2111.93
    累计百分比22.3640.6554.0464.0419.0737.8952.1064.04
    因子矩阵年龄0.395-0.241-0.136-0.0700.0280.454-0.377-0.295
    性别-0.259-0.1000.4430.741-0.1610.0140.0370.924
    居住安排-0.2260.1410.536-0.629-0.1500.0590.895-0.105
    住房面积-0.2020.4180.3810.0150.289-0.2050.5740.300
    人均可支配收入0.3300.519-0.0060.1310.8210.0350.009-0.045
    文化程度0.2960.510-0.0980.0610.775-0.045-0.011-0.134
    身体健康0.451-0.1960.381-0.0980.1050.8010.014-0.065
    精神健康0.254-0.3960.325-0.014-0.2370.672-0.0650.057
    健康养老支出0.4700.1110.3040.1410.4920.588-0.0280.071
    Table 2. Results of factor analysis for respondents in typical communities in Beijing
    贫困线门槛≤ -0.5倍标准差≤ -1.0倍标准差≤ -1.5倍标准差≤ -2.0倍标准差
    贫困样本总数(个)197(31.8%)82(13.2%)35(5.7%)8(1.3%)
    属性变量水平贫困样本数(个)贫困比例排序贫困样本数(个)贫困比例排序贫困样本数(个)贫困比例排序贫困样本数(个)贫困比例排序
    年龄(岁)< 60550.3821250.1741100.069100.0004
    60~64580.3602180.1125100.062220.0122
    65~69260.2954100.114440.045510.0113
    70~79450.2655210.124380.047450.0291
    ≥ 80180.321380.143230.054300.0004
    性别590.2532170.073280.034220.0092
    1380.3581650.1681270.070160.0161
    居住安排独自生活210.309360.088220.029300.0003
    他人同住20.333200.000400.000400.0003
    老人同住620.2504200.0813110.044220.0082
    子女同住1120.3771560.1891220.074160.0201
    人均可支配收入(元/月)≤ 1000770.9281520.6271310.373180.0961
    1001~30001180.4592300.117240.016200.0002
    3001~500020.010300.000300.000300.0002
    5001~1000000.000300.000300.000300.0002
    > 1000000.000300.000300.000300.0002
    文化程度1401.0001330.8251210.525170.1751
    21380.5052470.1722140.051210.0042
    3180.101320.011300.000300.0003
    410.014400.000400.000300.0003
    500.000500.000400.000300.0003
    身体健康非常健康1030.3761550.2011260.095180.0291
    基本健康820.2812230.079390.031200.0002
    部分自理110.250330.068400.000300.0002
    无法自理10.111410.111200.000300.0002
    精神健康非常健康1000.2663370.0983140.037310.0033
    基本健康920.3882410.1732190.080260.0252
    部分自理50.833140.667120.333110.1671
    无法自理00.000400.000400.000400.0004
    健康支出11060.5551690.3611330.173180.0421
    2430.352280.066220.016200.0002
    3230.193330.025300.000300.0002
    4190.188420.020400.000300.0002
    560.077500.000500.000300.0002
    600.000600.000500.000300.0002
    Table 3. Comparison of different thresholds for poverty line
    ID居住社区类型样本数(个)贫困样本数(个)老年贫困人口比例(%)95%置信区间(%)人均可支配收入≤ 1000元/月的老年人口比例(%)
    R1中心城区混合社区10165.92.8~12.45.0
    R2廉租房社区621016.19.0~27.28.1
    R3旧城四合院街坊社区9744.11.6~10.13.1
    R4单位大院840--3.6
    R5经济适用房社区9855.12.2~11.410.2
    R6普通商品房社区941010.65.9~18.520.2
    R7县镇老旧社区663857.645.6~68.847.0
    R8城乡混合社区17952.931.0~73.841.2
    Table 4. Estimated poverty rates of older people by community type
    功能分区地域范围面积(km2)城市老年人口*(千人)城市老年贫困人口(千人)城市老年贫困比(%)城市老年贫困人口密度(人/km2)
    首都功能核心区东城、西城的32个街道92.5364.319.15.24206.5
    城市功能拓展区朝阳、海淀、丰台、石景山的68个街道594.7929.560.16.47101.1
    城乡结合部朝阳、海淀、丰台、石景山的25个地区办事处445.2111.220.418.3545.8
    中心城区以外其他8区的22个街道223.3134.947.435.14212.3
    研究区合计147个行政单元1355.71539.9147.09.55108.4
    Table 5. Distribution of poor urban people in different areas of Beijing
    Xiaolu GAO, Danxian WU, Bingqiu YAN. Measure and distribution of urban elderly in poverty: An empirical study in Beijing[J]. Acta Geographica Sinica, 2020, 75(8): 1557
    Download Citation