
T. A. Shelkovenko, I. N. Tilikin, S. A. Pikuz, A. R. Mingaleev, V. M. Romanova, L. Atoyan, D. A. Hammer. Explosion dynamics of thin flat foils at high current density[J]. Matter and Radiation at Extremes, 2022, 7(5): 055901
- Matter and Radiation at Extremes
- Vol. 7, Issue 5, 055901 (2022)
Abstract
I. INTRODUCTION
For several decades, flat foils of different thicknesses have been used as fast switches in high-power high-voltage pulsed current generators1–3 and for shock wave generation.4,5 Studies of the interaction of extreme ultraviolet (XUV) radiation with foils6,7 and of the UV radiation emitted by exploding foils are both interesting research topics with possible applications.8 A prerequisite for the successful application of exploding thin foils is an understanding of the phenomena and processes associated with the explosions of flat thin foils made of various materials, as well as the acquisition of additional information about the processes associated with wire9,10 and cylindrical liner explosions, including those in magnetized liner inertial fusion (MagLIF) experiments.11–14 Experiments with exploding flat foils will help to reveal common features and differences in the processes of flat foil, wire-array, and cylindrical liner explosions. The present work is aimed at studying the features of nanosecond explosions of flat foils for various parameters of different high-current generators.
Many results from the series of experiments reported here have been published in previous papers,8,15–19 including studies of such properties of exploding foils as the formation and expansion of the core and corona16,17 and the effect of the original structure of the foils on the structure of the exploded foils.15,18,19 Note that when discussing the structure of the foil here, we are referring to the inhomogeneity of the radiation of the exploded foil or the inhomogeneity of the radiation absorption of the backlighter source by the foil. In this paper, we have tried to exclude the influence of the initial structure of the foils on the structure of the exploding foils. Thus, all experimental results presented here were obtained using foils without a one-dimensional initial structure visible through point-projection radiography.15,19 The aim of the experiments was to study in general terms the process of foil explosion from beginning to end under various explosion conditions.
II. EXPERIMENTAL SETUP AND DIAGNOSTICS
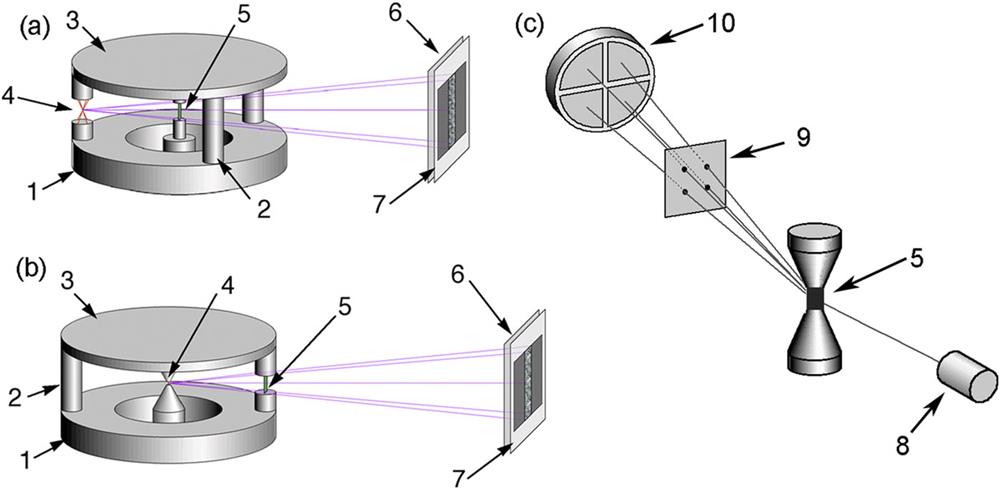
The experiments on flat foil explosions were carried out on the GVP, KING, BIN, XP, and COBRA pulsed power generators. In these experiments, only thin foils without skin effect under our experimental conditions were studied. The foils were exploded in a vacuum. Measurements were obtained at (1–2) × 10−4 Torr. Note that on all the generators used, the foil was attached to the high-voltage electrodes with copper tape. On the GVP, KING, and COBRA generators, the foils were placed in the main circuit [Fig. 1(a)]. Since the resistance and inductance of the foils are small, almost the entire current of the generator, in principle, can flow through them. On the COBRA generator, one or three X-pinches were placed in the return current circuit instead of return current rods for use in point-projection radiography [Fig. 1(a)].20,21 On the BIN and XP generators, the foils were located in the return current circuit, and one hybrid X-pinch was located in the main circuit [Fig. 1(b)]. The currents through the foils and through the X-pinches in the return current circuit were measured using calibrated Rogowski coils. To change the current through a foil in the return current circuit, the geometries of the rods and the foil were changed to adjust the inductance of the circuit. The output current parameters of the KING generator do not allow X-pinches to work reliably, and so on KING generator the point-projection radiography was not used. The results of experiments on the GVP generator are presented in Refs. 18 and 19. Here, we present the results of investigations of the stage of foil disintegration using laser diagnostics.9,22 The generator parameters, foils, and X-pinches are given in Table I.
![]()
Figure 1.Arrangement of foils and X-pinches for radiography in the high-voltage diodes of (a) the COBRA, KING and GVP generators and (b) the XP and BIN generators, together with (c) the arrangement for obtaining UV images of the explosions of flat foils with time resolution. Key: 1, cathode plate; 2, return current rods; 3, anode plate; 4, X-pinch, 5; flat foil; 6, 12.5
| Generator | Generator | Current through | |
|---|---|---|---|
| (Institution | parameters I, V, trt | Foils | foils (kA) |
| GVP (LPI) | 8 kA, 20 kV, 350 ns | 4 μm Al | 7.0–7.5 |
| KING (LPI) | 200 kA, 200 ns, 40 kV | 4 μm Al; 12.5 μm Ti | 180–200 |
| BIN, LPI | 250 kA, 300 kV, 100 ns | 4 and 16 µm Al; 5 µm Ni; 1 and 10 µm Cu | 40–80 |
| XP (CU) | 400 kA, 350 kV, 100 ns | 4, 12, and 16 µm Al; 5 µm Ni; 5 and 10 µm Cu; 12.5 µm Ti | 60–150 |
| COBRA (CU) | 1000 kA, 600 kV, 100 ns | 4–100 µm Al, Cu, Ti | 850–1000 |
Table 1. Generator and load parameters.
For the initial stage of the process, diagnostics that allow recording of the radiation of the exploding foil in the optical and UV ranges are most suitable. Study of the structure of exploded foils using point-projection radiography gives results in the later stages of the explosion, when the structure of the foils begins to differ from their original structure. Depending on the results, different diagnostics can be used in the final stages of the explosion. Note that of the many diagnostics available, only two can see the surface of the foil at an angle of 90°, as shown in Fig. 1(c). This is especially important for projection diagnostics, such as radiography and laser probing. Only one foil surface is depicted in that case. On the other side of the foil, a photoconducting detector (PCD) without a filter was usually used to compare the results of different shots in which identical signals were registered [Fig. 1(c)]. Not all available diagnostics could be used simultaneously.
The COBRA generator was equipped with numerous diagnostics, especially in the UV and optical spectral ranges in which the exploded foils radiate. The KING generator was equipped with one four-frame UV camera like the two on COBRA. A four-channel electro-optical converter based on a microchannel plate (MCP) was used to obtain four images with time resolution on each camera.23 This enabled recording of the radiation within the energy range from UV to soft x-rays (SXR) with an energy of greater than 1 keV. The field of the MCP was divided into four sectors, each of which was controlled independently. (On the KING generator, one of these was not used in these experiments, since it had significantly lower sensitivity.) The UV images of exploded objects were projected onto the MCP using four pinhole cameras without filters and with aperture diameters of 100 µm on COBRA and 40 or 200 µm on KING, which allowed four frames to be obtained at different times. The minimum energy of the recorded photons was determined by the diameter of the aperture and its distance from the exploding object and was 55 eV for COBRA and 50 or 15 eV for KING.24 On the COBRA generator, the two identical MCP cameras viewed the surface of the foil at an angle of 90° and from the top.
A 12-frame optical imaging system with 2 ns frame and 10 ns between frames was also used in the experiments on the COBRA generator. Time-integrated pinhole images in UV and x-ray radiation of the exploded foils were obtained on all generators, using pinholes with 40 and 100 µm diameters. The images were recorded using Fuji TR imaging plates (without coating).
The structure of the exploding foils was studied using point-projection radiography employing the bright subnanosecond x-ray bursts (“hot spots”) produced by the hybrid X-pinches as a point source of soft x-ray radiation.20,21 This diagnostic can provide high spatial and temporal resolution with a field of view limited only by the geometry of the experiment and the film dimensions; therefore, it was possible to study foils with large surface areas. Laser shadowgraph imaging systems were in use on the COBRA and GVP generators.9,22 They could be used to image the exploding foil plasmas in the initial and final stages of the foil explosion, when the self-emission of the foil was either not yet or no longer intense.
III. EXPERIMENTAL RESULTS
In general, the overall process of foil explosion can be divided into several stages: foil breakdown, formation of a core and corona of the foil and a plasma precursor in the corona, and foil decay at low currents and its implosion at high. In this work, the breakdown of the foil and the formation of a precursor are investigated in detail. The remaining stages of foil explosion are presented in general terms.
Time-integrated pinhole images recorded on Fuji TR imaging plates on all generators show intense UV radiation mostly in the central part of the foils. The rest of the foil gives less intense nonuniform radiation, with more intense radiation at the foil edges (Fig. 2).
![]()
Figure 2.Time-integrated pinhole images (side view) of exploded 4
The pinhole cameras without time resolution showed similar pictures of the foil explosion on the COBRA and XP generators, despite the significant difference in the maximum current through the foils (Fig. 2 and Table I). Time-resolved pinhole images obtained in visible (Fig. 3) and UV (Fig. 4) radiation on COBRA show that the radiation of an exploding foil begins at its edges. The foil image and its intensity profile in the second frame [Figs. 3, 4(a-2), and 4(b-2)] show that optical and UV radiation are registered only at the edges of the foil. After some time (<10 ns for 7 μm Cu foil and <30 ns for 100 μm Al foil) the optical radiation is recorded from the entire surface of the foil: the entire surface begins to radiate. More intense radiation is recorded from the central part of the foil and the edges. The radiation intensity profiles [Figs. 4(b-3) and 4(b-4)] show that the radiation intensity at the edges and in the center is approximately the same at the time of registration. On the last frame in Fig. 3, the stage of foil explosion close to its pinching is shown, since the radiation is recorded mainly in the central part of the foil. Note that the numbers on the figures presented below indicate the timing of the frames relative to the beginning of the generator current.
![]()
Figure 3.Set of visible light framing images of an exploding 100
![]()
Figure 4.(a) Time-resolved pinhole images (side view) of exploded 7
A Ni foil shows explosion dynamics similar to that of a Cu foil of the same thickness (Fig. 5), and the foil goes through similar explosion stages. Figure 5 shows mainly the later stages of Ni foil explosion. It can be seen that the first frame practically repeats the third frame of the Cu foil explosion, after which the central radiating part becomes wider and radiates more intensely.
![]()
Figure 5.Time-resolved pinhole images (side view) of exploded 7
Experiments aimed at systematic study of the dynamics of exploding foils in UV radiation were continued on the small-sized KING generator.23 One of the reasons for this was that KING is simpler and easier to use than COBRA, on which long-term experimental research is difficult and expensive. On KING, it was possible to use the same MCP recorder as on COBRA, whereas electrical noise would have made this difficult on the older XP and BIN generators. However, the output parameters of KING are radically different from those of COBRA (see Table I). Therefore, the first question that arose concerned the intensity of UV radiation on KING compared with that on COBRA. Experiments were carried out on KING to study the explosion of Al and Ti foils (see Table I). The MCP recorder was applied using pinhole cameras with 30 and 200 μm hole diameters.
Because of the relatively small output voltage in experiments on KING, the quality of the foil contact with the cathode of the high-voltage diode turned out to be a very important factor. This was probably attributable to the much lower voltage at the high-voltage electrode. Figure 6 shows UV images of the initial stage of the explosion of an Al foil with a thickness of 4 μm, a width of 1.5 mm, and a length of 3 mm. In the first frame, recorded 5 ns after the start of the current, UV radiation is registered in the upper part of the right edge of the foil. In the second and third frames, this edge still radiates noticeably more than the rest of the foil except for the middle part. In experiments with a pinhole camera with a diameter of 30 μm, images with good spatial resolution were recorded, but the radiation intensity of the edges of the foil was not clear enough to obtain an explicit image. It can be assumed that on the KING generator, the foil breakdown begins at the edges, but its energy is less than 55 eV—the cutoff energy of the system used. To obtain an image of the edges of the foil, a large-diameter pinhole camera (200 μm) was used, which increased the intensity of the recorded radiation by reducing the cutoff energy from 55 to 15 eV.
![]()
Figure 6.Time-resolved pinhole images (side view) (
Figure 7 shows UV images of the initial stage of the explosion of an Al foil with a thickness of 4 μm, a width of 2 mm, and a length of 3 mm. The third frame of the image recorded by the 200 μm pinhole camera shows that UV radiation has already appeared on the edges of the foil but not in the center. It can also be seen that the breakdown of the edges of the foil with a small width and length occurs 5–10 ns after the start of the current, but the intensity of UV radiation is not high. Experiments showed that the radiation of longer Al foils with a thickness of 4 μm also begins on the edges, but later than in the case of a short foil (Fig. 7).
![]()
Figure 7.Pinhole images (side view) of exploded Al foil with a thickness of 4
It should be noted that long (>6 mm) Al and Ti foils (Figs. 8 and 9) show significantly more uniform breakdown along the length of the foil, without any pronounced influence from the quality of the contact of the foil with the electrodes (Figs. 6 and 7). With Ti foils, the radiation at the edges is very weak, possibly because of the 50 eV lower energy cutoff in those images (Fig. 9).
![]()
Figure 8.(a) Pinhole images (side view) and radiation intensity profiles of an exploding Al foil with a thickness of 4
![]()
Figure 9.Pinhole images (side view) of exploded Ti foil with a thickness of 12.5
Time-resolved pinhole images and radiation intensity profiles of an exploded long Al foil show that the intensity of UV radiation in the central part of the foil is significantly higher than at its edges (Fig. 8). The radiation intensity of the central part also increases over time. Note that the radiation intensity of foils of different materials exploded on generators with very different output parameters is very different and goes far beyond the range of the linear response of MCPs. Therefore, a direct comparison under the same radiation conditions of different foils is practically impossible. From the above images and radiation intensity profiles, it can be concluded that the radiation intensity of the edges of the foil (Ecut > 50 eV) is much less than on the COBRA generator. The high intensity of radiation in the central part of the foil indicates more heating and a greater degree of ionization of the material.
No MCP cameras were used on the XP and BIN generators, and so the conclusions about the dynamics of the foil explosions presented below could be drawn only from time-integrated UV images and x-ray images obtained using point-projection imaging of the exploding foils. The time-integrated UV images shown in Figs. 2(a) and 2(b) are very similar to the later stages of the foil explosions recorded on the COBRA and KING generators. Therefore, we can assume that the dynamics of the foil explosions on all the generators used have features in common.
X-ray images recorded on generators with different output voltages and currents through the foil show that the dynamics of the explosions of foils of different materials also have common features (Figs. 10 and 11).18 Radiographs show a significant difference between the conditions in the central and peripheral parts of the foil. The radiographs in Fig. 10 demonstrate that at the moment at which the image is recorded, bubbles of various diameters form in the central part of the exploding Cu foil. The bubbles later merge in the central part of the foil. At the same time, part of the core mass is shifted to the foil areas farther from the center (within 1 mm on both sides of the center). Figure 11 shows x-ray images of Al foils with a thickness of 4 μm and approximately the same size, exploding on the XP generator with approximately the same current through the foil. It can be seen that over time, the bubbles grow in diameter, starting to merge in the central part of the foil and thereby forming an area in the center that is more transparent to x-ray radiation [Figs. 11(a) and 11(b)]. Displacement of the core mass to the periphery becomes more noticeable. At a later time, the entire central part of the foil looks like a homogeneous plasma region, and the entire foil begins to pinch, with the formation of noticeable instabilities at its edges [Fig. 11(c)].
![]()
Figure 10.Point-projection images of exploding Cu foils in radiation with energy 2.5 keV <
![]()
Figure 11.Point-projection images of exploding 4
The dynamics of the explosion of a foil at a late stage depend on the current flowing through the foil. At high currents, for example, in experiments on the COBRA generator, the core of the foil can stagnate at the foil center and form hot areas about 1 mm in size (Figs. 2 and 12). At the same time, soft x-ray radiation (E > 1 keV) is not recorded with PCDs, even in experiments on the COBRA generator. The experiments used foils with a mass that was selected for each generator to prevent pinching. Figure 12 shows UV images at different stages of stagnation of a Cu foil of thickness 7 μm. The fourth frame in the figure was recorded close to the greatest compression of the foil on the COBRA generator.
![]()
Figure 12.Time-resolved pinhole images of exploding 7
On generators with a low current through the foil during the late stage of the explosion, the foil disintegrates into separate drops that are clearly visible with the help of laser probing (Fig. 13).
![]()
Figure 13.Laser shadowgrams of flat 4
IV. DISCUSSION
One explanation for the strong heating of the central part of the exploded foils may be as follows. When the edges of the foil break down, a low-density and weakly ionized plasma is formed, which expands and pinches on both sides around the center of the foil. Thus, a plasma precursor is formed adjacent to the central part of the exploding foil above its surface, as happens in wire arrays.25–32 Part of the current begins to flow through this precursor, leading to its heating and compression. As the latest spectroscopic experiments conducted on the KING generator have shown, the parameters of the precursor plasma have quite high values.8 For exploded Al foils, the plasma electron temperature has been recorded in the range of 50–80 eV and the ion density in the range (2–8) × 1020 cm−3. These parameters are quite consistent with those of the precursors in cylindrical wire arrays.26 The precursor is formed in the central part of the foil close to its surface and can heat the material of the central part of the core with the formation of bubbles, up to evaporation and partial ionization of the core material.
Figure 14 shows UV images of a Cu foil explosion recorded when the pinhole camera with the MCP is positioned from above at an angle of 90° to the upper edge of the foil. It can be seen that breakdown begins at the edges of the foil at about 55 ns from the beginning of the current pulse, and there is a noticeable difference in the intensity of radiation, probably due to the difference in the quality of contact of the edges of the foil with the electrodes. After 10 ns, radiation is recorded from the entire surface of the foil, a precursor is formed above its surface, and the asymmetry, still noticeable in the third frame, completely disappears in the fourth frame. Bright UV radiation is observed, both from the core of the foil and from the precursor localized above the center of the foil. We think that the bright radiation imaged in the center of the exploding foils in Figs. 3–5, 7, 8, and 11 is also due mainly to the radiation of the precursor. In later frames, the central radiating area becomes brighter and wider. At the same time, spread of this area to the entire foil, or even to most of it, is never observed. Probably, the precursor is compressed by the current flowing through it, which leads to an increase in density and compensates for its expansion due to evaporation of the core material.
![]()
Figure 14.(a) Layout of the foil in a high-voltage diode: 1, cathode; 2, return current rods; 3, anode; 4, Cu tape; 5, foil. (b) pinhole images (top view) of exploded Cu foil with a thickness of 7
V. CONCLUSIONS
From experimental studies of the explosion of thin flat foils using generators with a wide range of output parameters, we have concluded that the explosion of foils is a complex process that depends on many factors, some of which are yet to be identified. In this work, common features of the explosion of foils have been found that do not depend on either the generator parameters or on the material, size, and structure of the foil. We have been able to conclude that the breakdown of flat foils under different conditions occurs at the edges of the foil. At the same time, the process of heating the foil at its center is more rapid, owing to the formation of a plasma precursor above its surface. We have found that the use of significantly more powerful generators that significantly increase the current density does not lead to any fundamental change in the nature of the flat foil explosion. On the basis of these experiments, we can conclude that the formation of a precursor is a universal process for both wire arrays and flat foil loads. It is important to take this into account when using foil loads in applications.
ACKNOWLEDGMENTS
Acknowledgment. The research on the COBRA and XP generators is supported by Grant No. DE-NA0003764 and that on the BIN, KING, and GVP generators by the Russian Science Foundation, Project No. 19-79-30086.
References
[1] V. S.Sedoi, G. A.Mesyats, L. I.Chemezova, V. V.Valevich, V. I.Oreshkin. IEEE Trans. Plasma Sci., 27, 845(1999).
[2] A. V.Luchinskii, N. V.Kalinin, V. A.Burtsev. Electric Explosion of Conductors and Its Application in Electrophysical Plants(1990).
[3] V. M.Koval’chuk, G. A.Mesyats, Yu. A.Kotov. High-Power Nanosecond Pulsed Sources of Accelerated Electrons, 130(1974).
[4] W. G.Chase, G.Chase W., H. K.Moore. Exploding Wires(1962).
[5] M.Takayuki, N.Matsuo, M.Otsuka, S.Itoh. Proc. SPIE, 7522, 75222A(2010).
[6] Yu. M.Gorbulin, V. N.Makhov, A. V.Bartov, K. A.Baigarin, M. V.Babykin. Sov. J. Plasma Phys., 8, 237(1982).
[7] A. V.Branitskii, G. M.Oleinik, E. V.Grabovsky, M. M.Basko, V. V.Aleksandrov, P. V.Sasorov, K. N.Mitrofanov, A. N.Gritsuk, I. N.Frolov. Plasma Phys. Rep., 47, 669(2021).
[8] A. A.Kologrivov, A. A.Rupasov, A. R.Mingaleev, V. R.Romanova, I. N.Tilikin, T. A.Shelkovenko, E. A.Bolkhovitinov, S. A.Pikuz. Plasma Sources Sci. Technol., 30, 115012(2021).
[9] A. R.Mingaleev, S. A.Pikuz, T. A.Shelkovenko, V. M.Romanova, A. E.Ter-Oganesyan, G. V.Ivanenkov. Plasma Phys. Rep., 41, 617(2015).
[10] S. A.Chaikovsky, I. I.Beilis, R. B.Baksht, V. I.Oreshkin, A. G.Rousskikh, N. A.Labetskaya, A. V.Shishlov. Phys. Plasmas, 15, 102706(2008).
[11] K. J.Peterson, D. G.Schroen, R. D.McBride, E. P.Yu, C. A.Jennings, D. B.Sinars, K.Tomlinson, M. R.Gomez, A. B.Sefkow, M. R.Martin, R. A.Vesey, S. A.Slutz, T. J.Awe, S. E.Rosental. Phys. Rev. Lett., 116, 065001(2016).
[12] K. J.Peterson, D. B.Sinars, I. C.Smith, M. C.Herrmann, C.Nakhleh, M. D.Knudson, M. E.Cuneo, E. P.Yu, S. A.Slutz, B. W.Atherton. Phys. Plasmas, 19, 092701(2012).
[13] R. A.Vesey, M. R.Gomez, S. B.Hansen, P. F.Schmit, A. B.Sefkow, P. F.Knapp, C. A.Jennings, M.Geissel, R. D.McBride, K. D.Hahn, D. C.Rovang, T. J.Awe, E. C.Harding, S. A.Slutz, A. J.Harvey-Thompsonet?al.. Phys. Plasmas, 23, 012705(2016).
[14] S. A.Pikuz, T. A.Shelkovenko, J. B.Greenly, B. R.Kusse, T.Byvank, D. A.Hammer, L.Atoyan, A. D.Cahill. Phys. Plasmas, 23, 022708(2016).
[15] I. N.Tilikin, T. A.Shelkovenko, V. M.Romanova, S. A.Pikuz, D. A.Hammer, L.Atoyan, S. N.Mishin. IEEE Trans. Plasma Sci., 46, 3741(2018).
[16] A. R.Mingaleev, D. A.Hammer, L.Atoyan, I. N.Tilikin, T. A.Shelkovenko, S. A.Pikuz. Plasma Phys. Rep., 44, 236(2018).
[17] A. R.Mingaleev, V. M.Romanova, I. N.Tilikin, T. A.Shelkovenko, S. A.Pikuz. J. Exp. Theor. Phys., 128, 946(2019).
[18] I. N.Tilikin, S. A.Pikuz, A. R.Mingaleev, T. A.Shelkovenko, D. A.Hammer, V. M.Romanova. J. Appl. Phys., 128, 205902(2020).
[19] A. R.Mingaleev, I. N.Tilikin, T. A.Shelkovenko, S. A.Pikuz. Phys. Plasmas, 27, 043508(2020).
[20] S. A.Pikuz, T. A.Shelkovenko, D. A.Hammer. Plasma Phys. Rep., 42, 226(2016).
[21] S. N.Bland, M. D.Mitchell, T. A.Shelkovenko, D. A.Hammer, S. A.Pikuz, I. N.Tilikin. Matter Radiat. Extremes, 3, 267(2018).
[22] G. V.Ivanenkov, A. S.Selyukov, E. V.Parkevich, S. A.Pikuz, V. M.Romanova, M. A.Medvedev, I. N.Tilikin, T. A.Shelkovenko. J. Phys. D: Appl. Phys., 54, 175201(2021).
[23] V. B.Zorin, A. A.Rupasov, E. A.Bolkhovitinov, S. A.Pikuz, A. R.Mingaleev, I. N.Tilikin, V. M.Romanova, T. A.Shelkovenko, A. A.Kologrivov. Plasma Phys. Rep., 46, 10(2020).
[24] S. A.Pikuz, T. A.Shelkovenko, D. A.Hammer. Plasma Phys. Rep., 41, 291(2015).
[25] J. D.Douglass, J. B.Greenly, K. S.Bell, I. C.Blesener, S. A.Pikuz, D. A.Hammer, R. D.McBride, D. A.Chalenski, B. R.Kusse, P. F.Knapp, T. A.Shelkovenko. Phys. Plasmas, 16, 012706(2009).
[26] B.Kusse, J. D.Douglass, J. P.Chittenden, D. J.Ampleford, D. A.Hammer, J. B. A.Palmer, S. V.Lebedev, A.Marocchino, A.Esaulov, F. N.Beg, M. G.Haines, Y.Eshaq, K.Bell, A.Harvey-Thomson, F. A.Suzuki Vidal, R. D.McBride, I. C.Blesener, P.Knapp, U.Ueda, T. A.Shelkovenko, S. N.Bland, D. M.Haas, S. C.Bott, G. N.Hall, J.Greenly, S. A.Pikuz. Phys. Plasmas, 16, 072701(2009).
[27] S. A.Pikuz, S. V.Lebedev, T. A.Shelkovenko, J. P.Chittenden, J. B. A.Palmer, M. G.Haines, D. J.Ampleford, C.Jennings, T.Christoudias, S. C.Bott, D. A.Hammer, S. N.Bland, J.Goyer, G. N.Hall. Plasma Phys. Controlled Fusion, 47, A91(2005).
[28] R. G.Adams, E. M.Waisman, D. B.Sinars, I. C.Smith, R. A.Vesey, P. K.Rambo, W. A.Stygar, E. P.Yu, K. W.Struve, J. L.Porter, D. E.Bliss, T. A.Mehlhorn, T. J.Nash, M. G.Mazarakis, G. A.Chandler, R. W.Lemke, M. E.Cuneo. Phys. Plasmas, 13, 056318(2006).
[29] D. J.Ampleford, S. V.Lebedev, S. C.Bott, J. B. A.Palmer, T. A.Shelkovenko, F.Suzuki-Vidal, S. A.Pikuz, J. P.Chittenden, S. N.Bland, G. N.Hall. Phys. Plasmas, 14, 056315(2007).
[30] K.Williamson, G.Osborne, D. J.Ampleford, I.Shrestha, V. L.Kantsyrev, S. N.Bland, D. A.Fedin, C. A.Jennings, V.Nalajala, S. V.Lebedev, A. S.Safronova, A.Haboub, J. P.Chittenden, P. J.Laca, M. F.Yilmaz, S. C.Bott, V. V.Ivanov, A.Ciardi. Phys. Plasmas, 14, 102704(2007).
[31] P. D.LePell, C. A.Coverdale, A. S.Chuvatin, V. V.Ivanov, B.Jones, V. L.Kantsyrev, K.Williamson, C.Deeney, N. D.Ouart, T. E.Cowan, S.Pokala, D. A.Fedin, A. S.Safronova, V.Nalajala, L. I.Rudakov, P.Laca, A. L.Velikovich, A. A.Esaulov, I.Shrestha, M. F.Yilmaz. IEEE Trans. Plasma Sci., 34, 194(2006).
[32] A. S.Safronova, A.Astanovitsky, V. V.Shlyaptseva, M. E.Weller, S.Keim, M.Cooper, V. L.Kantsyrev, I.Shrestha, A. S.Chuvatin, A. A.Esaulov, L. I.Rudakov, A.Stafford, G. C.Osborne, A. L.Velikovich. Phys. Plasmas, 21, 031204(2014).

Set citation alerts for the article
Please enter your email address
© Copyright 2018-2021 | Chinese Laser Press. All Rights Reserved 沪ICP备15018463号-20