
Andrey Shaykin, Vladislav Ginzburg, Ivan Yakovlev, Anton Kochetkov, Alexey Kuzmin, Sergey Mironov, Ilya Shaikin, Sergey Stukachev, Vladimir Lozhkarev, Artem Prokhorov, Efim Khazanov, "Use of KDP crystal as a Kerr nonlinear medium for compressing PW laser pulses down to 10 fs," High Power Laser Sci. Eng. 9, 04000e54 (2021)
- High Power Laser Science and Engineering
- Vol. 9, Issue 4, 04000e54 (2021)
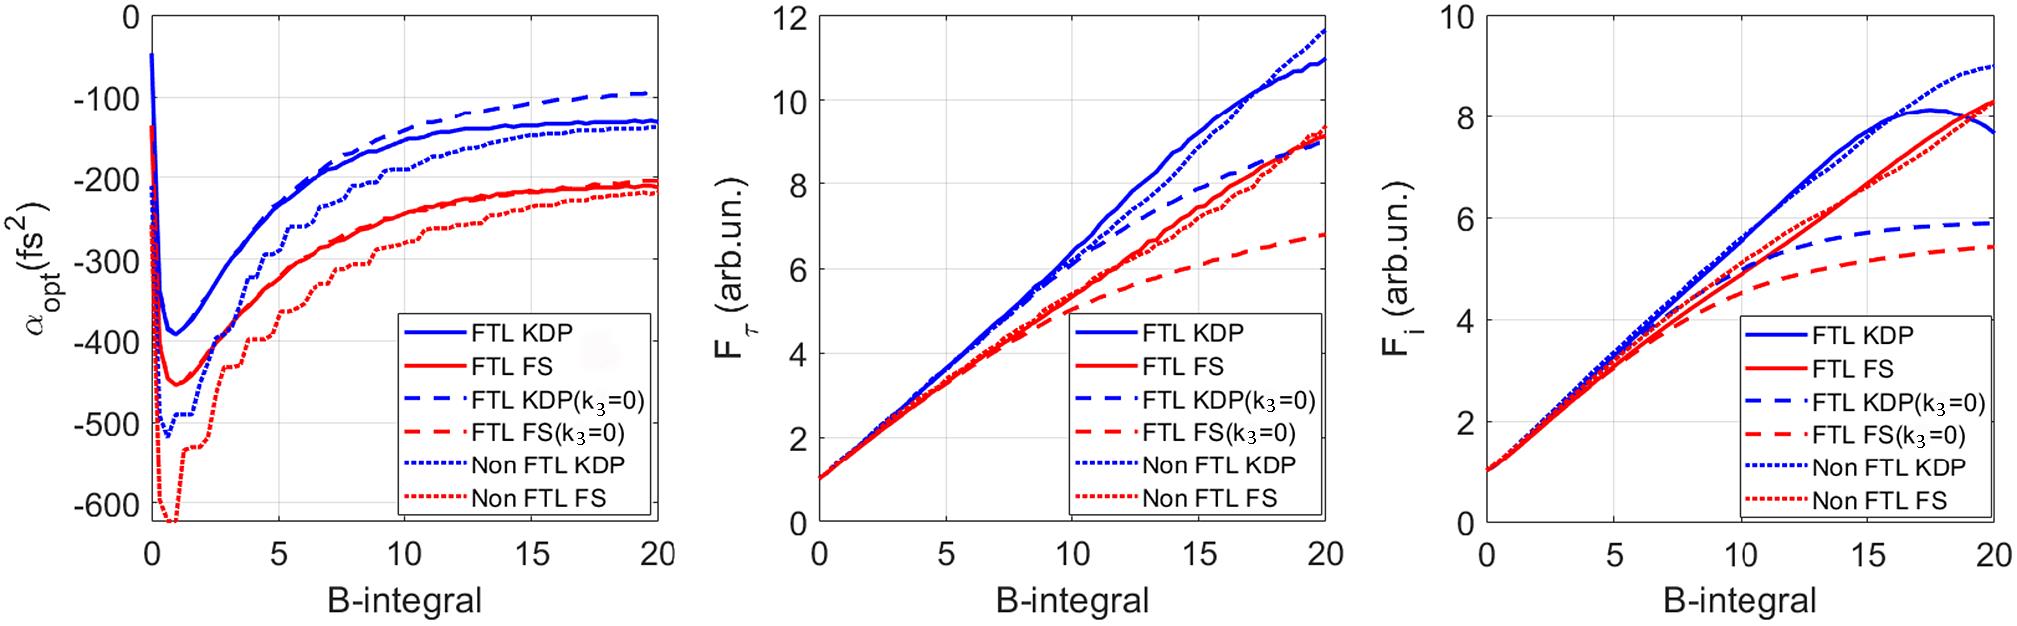
Fig. 1. Curves for (a) αopt(B ), (b) F τ(B ), and (c) F i(B ) for α = αopt for KDP (blue) and silica (red): FTL pulse at k 3 ≠ 0 (solid curves) and k 3 = 0 (dashed curves); non-Gaussian FTL pulse, the spectrum and autocorrelation function of which are presented in Figure 3(a) (dotted curves). FTL, Fourier-transform-limited.
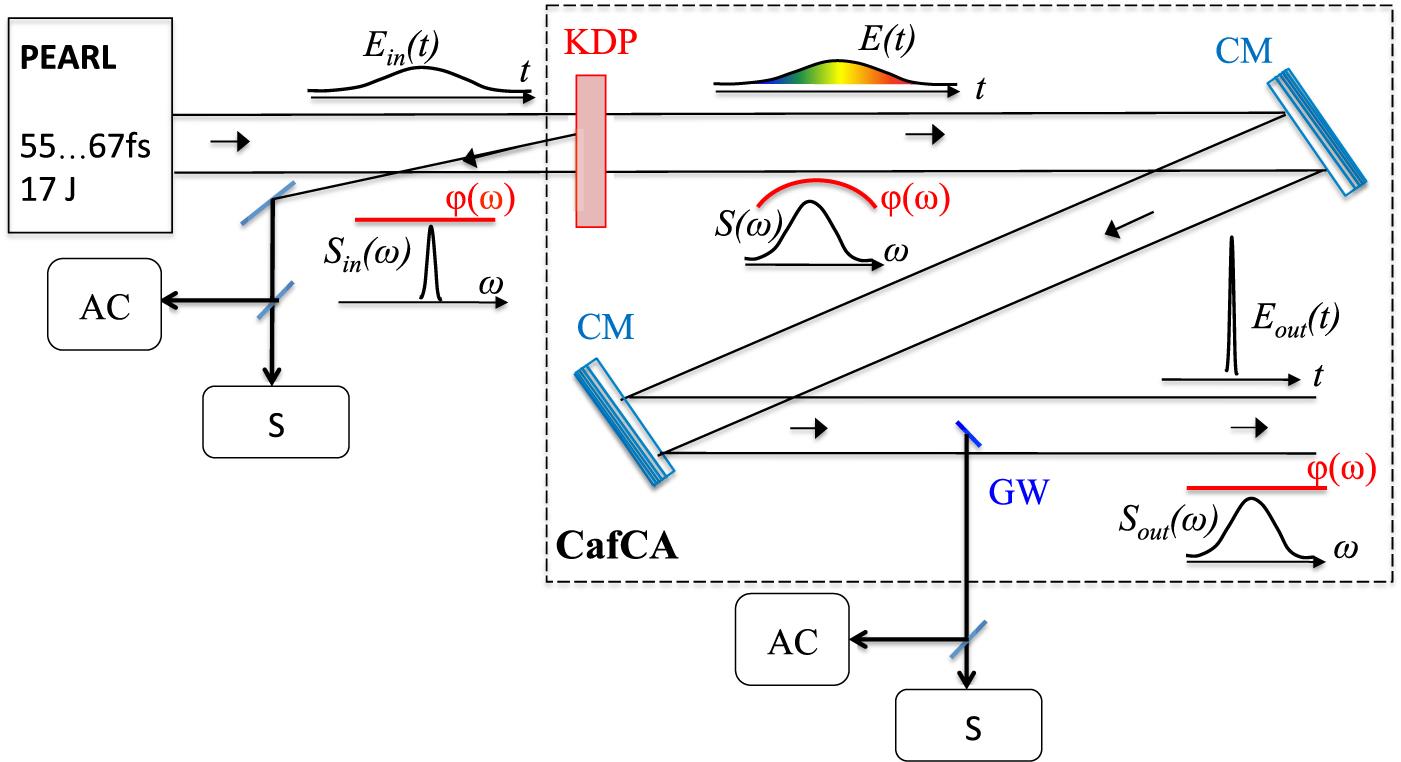
Fig. 2. Schematic of the experiment. CM, chirped mirror; GW, small-aperture glass wedge; AC, autocorrelator; S, spectrometer.
Fig. 3. Measured input (blue) and output (red) spectra and ACF for two typical shots: (a) B = 13, τin = 67 fs, τout = 10.9 fs and (b) B = 14, τin = 57 fs, τout = 10.1 fs.
Fig. 4. Experimental minimal compressed pulse duration τout for KDP (L = 4 mm), silica (L = 5 mm), and silica (L = 3 mm[15,20]) for two ranges of B values. The curves are plotted to make the figure more illustrative.
Fig. 5. Output pulse duration τout (blue) and pulse compression factor F τ = τin/τout (red) at α = −200 fs2; τin = 55, …, 67 fs.
| ||||||||||||||||||||||||||||||||||||||||
Table 1. The parameters of numerical modeling.


Set citation alerts for the article
Please enter your email address

© Copyright 2018-2021 | Chinese Laser Press. All Rights Reserved 沪ICP备15018463号-20