• Chinese Optics Letters
  • Vol. 18, Issue 12, 121902 (2020)
Kunpeng Jia1, Xiaohan Wang1, Xinjie Lü1, Ping Xu1、2, Zhenlin Wang1, Chee Wei Wong3, Gang Zhao1、*, Yan-Xiao Gong1、**, Zhenda Xie1、***, and Shining Zhu1
Author Affiliations
  • 1National Laboratory of Solid State Microstructures, School of Physics, School of Electronic Science and Engineering, College of Engineering and Applied Sciences, and Collaborative Innovation Center of Advanced Microstructures, Nanjing University, Nanjing 210093, China
  • 2Institute for Quantum Information and State Key Laboratory of High Performance Computing, College of Computing, National University of Defense Technology, Changsha 410073, China
  • 3Mesoscopic Optics and Quantum Electronics Laboratory, University of California Los Angeles, California, CA 90095, USA
  • show less
    DOI: 10.3788/COL202018.121902 Cite this Article Set citation alerts
    Kunpeng Jia, Xiaohan Wang, Xinjie Lü, Ping Xu, Zhenlin Wang, Chee Wei Wong, Gang Zhao, Yan-Xiao Gong, Zhenda Xie, Shining Zhu. Robust second-order correlation of twin parametric beams generated by amplified spontaneous parametric down-conversion[J]. Chinese Optics Letters, 2020, 18(12): 121902 Copy Citation Text show less
    Comparison of the second-order correlation of thermal light and ASPDC. (a) Thermal light correlation. The thermal light ET is mixed with vacuum field EV at a beam splitter. Therefore, the light fields E1 and E2 are from the same source even though G1,2(2) is measured at different space–time points. G1,2(2) can be expressed as G1,2(2)=GCor(2)+G1(1)G2(1), where the correlated term GCor(2) comes from the same frequency components in the two split beams, and the background term G1(1)G2(1) comes from different frequency components in the two split beams. (b) ASPDC correlation. The temporal correlation can be measured directly between the signal and idler beams, where the correlated term GCor(2) comes from signal frequency mode ωs and its inherently correlated counterpart in idler mode ωi=ωp−ωs, while the background term G1(1)G2(1) comes from the random combination with ω′s and ω′i≠ωp−ω′s.
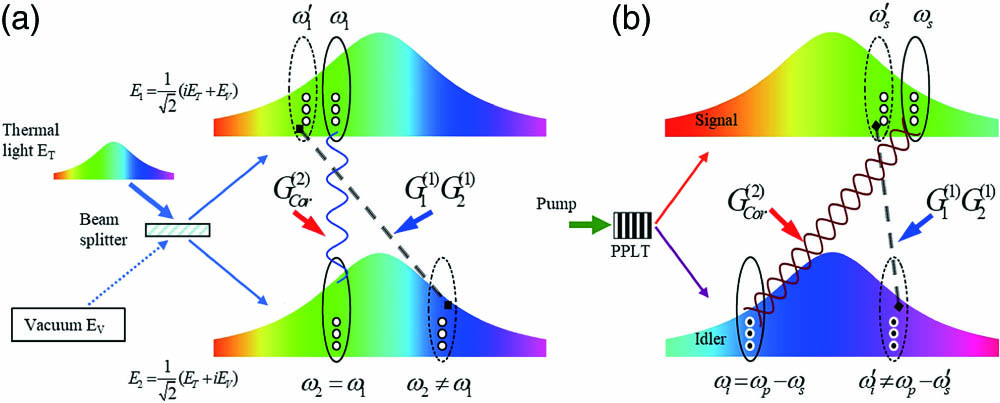
    Fig. 1. Comparison of the second-order correlation of thermal light and ASPDC. (a) Thermal light correlation. The thermal light ET is mixed with vacuum field EV at a beam splitter. Therefore, the light fields E1 and E2 are from the same source even though G1,2(2) is measured at different space–time points. G1,2(2) can be expressed as G1,2(2)=GCor(2)+G1(1)G2(1), where the correlated term GCor(2) comes from the same frequency components in the two split beams, and the background term G1(1)G2(1) comes from different frequency components in the two split beams. (b) ASPDC correlation. The temporal correlation can be measured directly between the signal and idler beams, where the correlated term GCor(2) comes from signal frequency mode ωs and its inherently correlated counterpart in idler mode ωi=ωpωs, while the background term G1(1)G2(1) comes from the random combination with ωs and ωiωpωs.
    Simulated visibility as a function of gain parameter. The visibility drops from one to about 48.3%, as the parametric process transforms from SPDC to ASPDC. The two vertical bars mark the range of the gain level achieved in our experiment, where the visibility can be considered as constant.
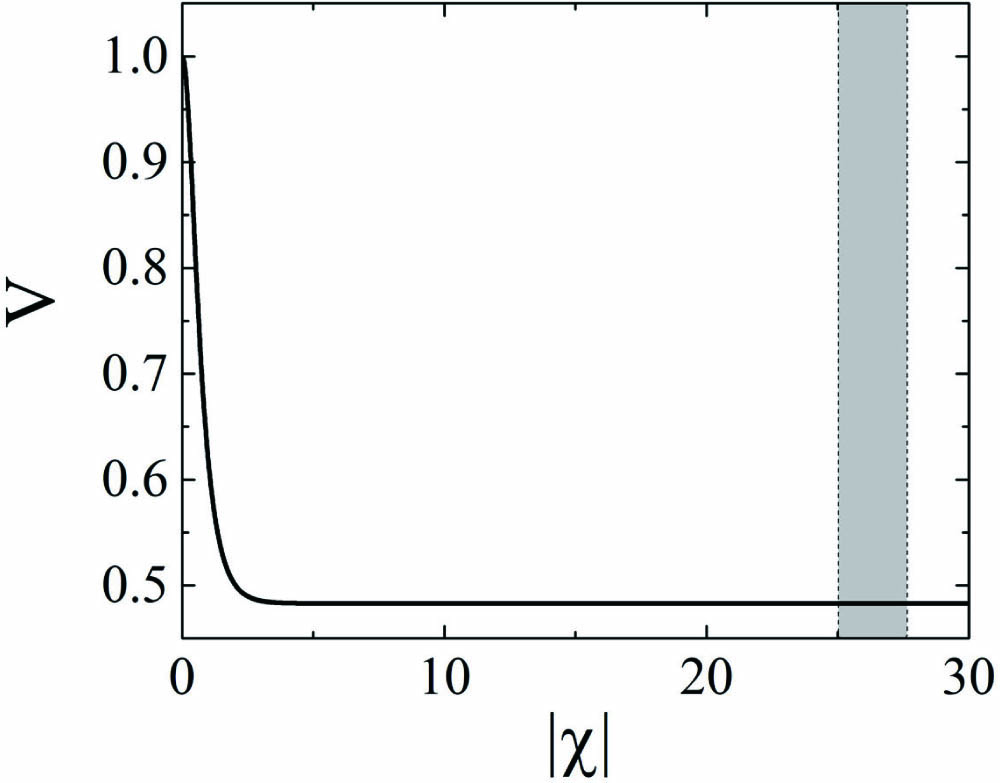
    Fig. 2. Simulated visibility as a function of gain parameter. The visibility drops from one to about 48.3%, as the parametric process transforms from SPDC to ASPDC. The two vertical bars mark the range of the gain level achieved in our experiment, where the visibility can be considered as constant.
    Schematic of experiment setup. BS, beam splitter; DM, dichromatic mirror; IF, interference filter; FFPC, fiber Fabry–Perot cavity; FPC, fiber polarization controller; FBG, fiber Bragg grating; Ai and Bi, fiber connectors; VOA, variable optical attenuator; HPF, 600 MHz high-pass RF filter (removable).
    Fig. 3. Schematic of experiment setup. BS, beam splitter; DM, dichromatic mirror; IF, interference filter; FFPC, fiber Fabry–Perot cavity; FPC, fiber polarization controller; FBG, fiber Bragg grating; Ai and Bi, fiber connectors; VOA, variable optical attenuator; HPF, 600 MHz high-pass RF filter (removable).
    ASPDC energy as a function of pump pulse energy.
    Fig. 4. ASPDC energy as a function of pump pulse energy.
    (a) Correlation of twin beams as a function of relative time delay, where the red curve shows the background given by the pulse profile of the twin beams. (b) Normalized correlation with exponential decay fit. (c) Visibility as a function of pump pulse energy and transmission of variable optical attenuator (VOA), respectively. (d) Correlation measurement with 600 MHz high-pass RF filters in the photon current.
    Fig. 5. (a) Correlation of twin beams as a function of relative time delay, where the red curve shows the background given by the pulse profile of the twin beams. (b) Normalized correlation with exponential decay fit. (c) Visibility as a function of pump pulse energy and transmission of variable optical attenuator (VOA), respectively. (d) Correlation measurement with 600 MHz high-pass RF filters in the photon current.
    Kunpeng Jia, Xiaohan Wang, Xinjie Lü, Ping Xu, Zhenlin Wang, Chee Wei Wong, Gang Zhao, Yan-Xiao Gong, Zhenda Xie, Shining Zhu. Robust second-order correlation of twin parametric beams generated by amplified spontaneous parametric down-conversion[J]. Chinese Optics Letters, 2020, 18(12): 121902
    Download Citation