• Journal of Geo-information Science
  • Vol. 22, Issue 10, 1996 (2020)
Tushi YANG1、2, Weiwen WANG1、2、*, Ming CHANG1、2, and Xuemei WANG1、2
Author Affiliations
  • 1Institute for Environmental and Climate Research, Jinan University, Guangzhou 511443, China
  • 2Guangdong-Hongkong-Macau Joint Laboratory of Collaborative Innovation for Environmental Quality, Guangzhou 511443, China
  • show less
    DOI: 10.12082/dqxxkx.2020.200242 Cite this Article
    Tushi YANG, Weiwen WANG, Ming CHANG, Xuemei WANG. Numerical Simulation and Comprehensive Identification of Potential Wind Corridors in Beijing[J]. Journal of Geo-information Science, 2020, 22(10): 1996 Copy Citation Text show less
    Topography of Beijing and surrounding areas
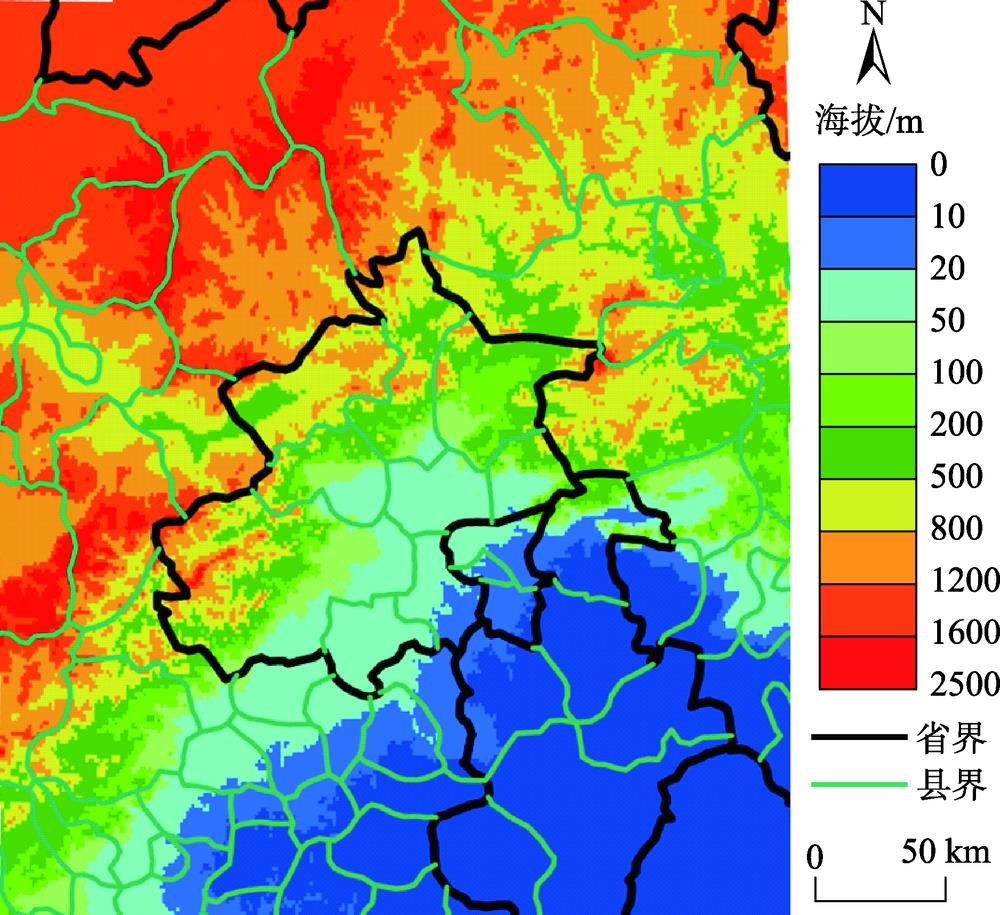
    Fig. 1. Topography of Beijing and surrounding areas
    Distribution of land use types in the WRF simulation area
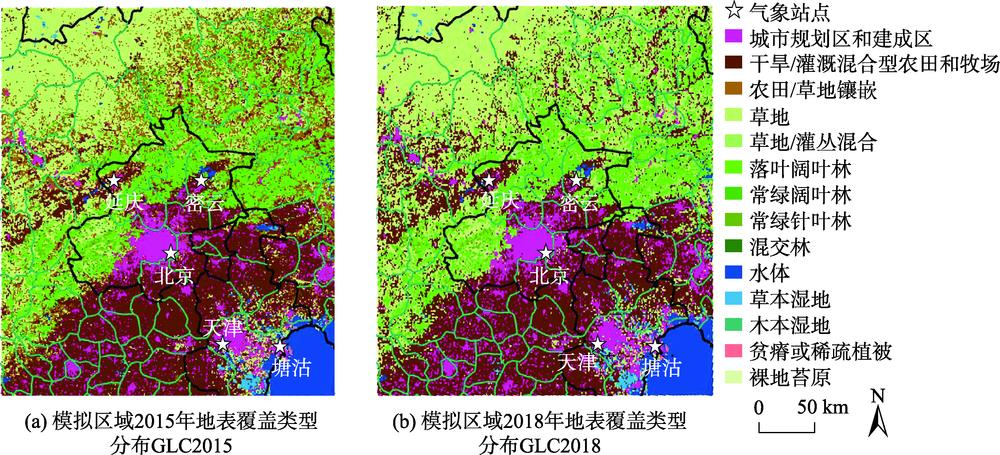
    Fig. 2. Distribution of land use types in the WRF simulation area
    The technology roadmap
    Fig. 3. The technology roadmap
    Daily series of wind speed at 10 m in January and July 2019
    Fig. 4. Daily series of wind speed at 10 m in January and July 2019
    Evaluation of ventilation performance by maximum roughness length (z0_max) based on USGS land use data (GLC2015)
    Fig. 5. Evaluation of ventilation performance by maximum roughness length (z0_max) based on USGS land use data (GLC2015)
    WRF-simulated mean wind speed and wind direction at 10 m above the ground
    Fig. 6. WRF-simulated mean wind speed and wind direction at 10 m above the ground
    WRF simulated mean surface temperature at 2 m above the ground (T2)
    Fig. 7. WRF simulated mean surface temperature at 2 m above the ground (T2)
    Dimensionless ventilation index (Iv) is determined by the order relation method of the surface temperature T2 and roughness of z0
    Fig. 8. Dimensionless ventilation index (Iv) is determined by the order relation method of the surface temperature T2 and roughness of z0
    Comprehensive analysis of ventilation grades in Beijing
    Fig. 9. Comprehensive analysis of ventilation grades in Beijing
    物理过程(英文名称)方案选择参考文献
    微物理(Microphysics)Purdue Lin schemeChen & Sun 54]
    长波(Long wave)RRTMGIacono等[55]
    短波(Short wave)Goddard shortwaveChou & Suarez[56],Matsui等[57]
    陆面(Land Surface)Noah Land Surface ModelChen & Dudhia[58]
    行星边界层(Planetary Boundary Layer)Yonsei University schemeHong等59]
    Table 1. Physical parameterization schemes in WRF simulation
    站点1月7月
    BIASRMSERBIASRMSER
    北京0.070.830.57-0.090.830.43
    天津0.281.010.490.201.160.20
    塘沽0.741.200.670.440.830.66
    密云1.401.790.331.021.440.22
    延庆0.341.290.34-0.380.770.29
    Table 2. Validation statistics of 10 m wind speed at stations from WRF output
    站点1月7月
    BIASRMSERBIASRMSER
    北京0.661.530.85-0.441.830.76
    天津2.172.390.89-0.511.540.85
    塘沽0.051.070.88-1.012.060.74
    密云4.595.040.720.251.640.78
    延庆4.765.340.68-1.892.360.80
    Table 3. Validation statistics of 2 m air temperature at stations from WRF output
    站点1月7月
    BIASRMSERBIASRMSER
    北京-0.151.890.93-1.181.590.95
    天津-0.331.920.93-0.601.200.95
    塘沽0.221.870.93-0.011.080.94
    密云2.032.880.92-1.641.940.95
    延庆1.882.740.90-0.741.270.94
    Table 4. Validation statistics of sea level pressure at stations from WRF output
    Tushi YANG, Weiwen WANG, Ming CHANG, Xuemei WANG. Numerical Simulation and Comprehensive Identification of Potential Wind Corridors in Beijing[J]. Journal of Geo-information Science, 2020, 22(10): 1996
    Download Citation