
Weihua LIU, Siyuan WANG, Yuanxu MA, Ming SHEN, Yongfa YOU, Kai HAI, Linlin WU. A Remote Sensing Method for Retrieving Chlorophyll-a Concentration from River Water Body [J]. Journal of Geo-information Science, 2020, 22(10): 2062
- Journal of Geo-information Science
- Vol. 22, Issue 10, 2062 (2020)
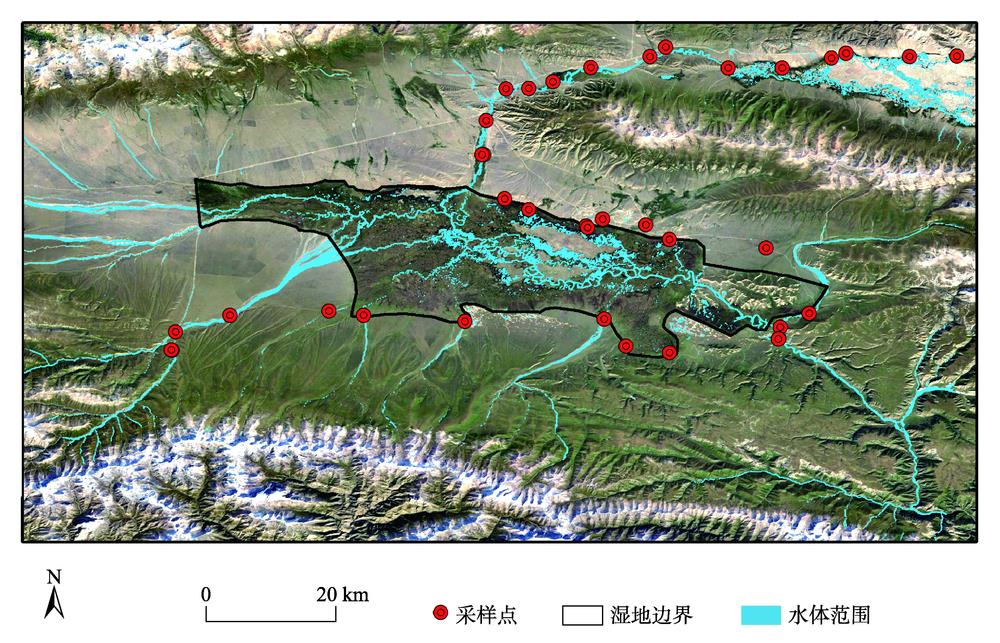
Fig. 1. Sampling point location in the Bayanbulak wetland grassland in Xinjiang
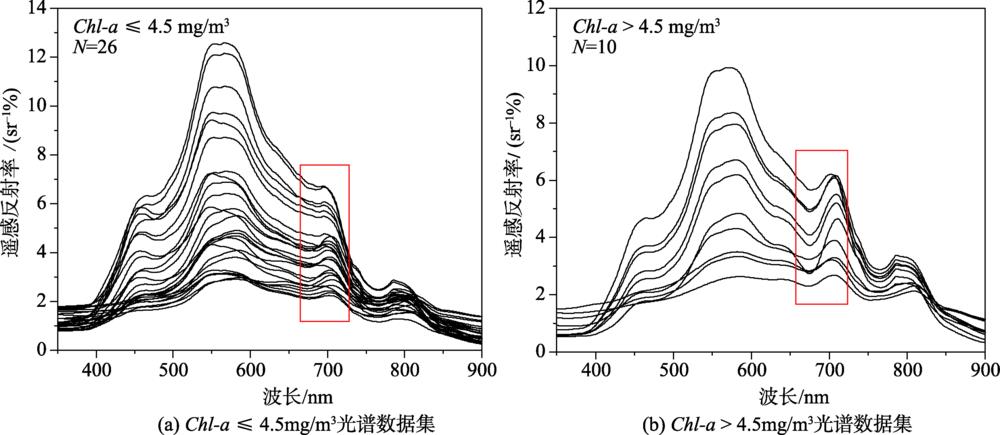
Fig. 2. Remote sensing reflectance above water surface of valid samples
Fig. 3. Framework for Chl-a estimation based on concentration classification
Fig. 4. Correlation coefficient between single-band remote sensing reflectance and in situ Chl-a
Fig. 5. Correlation coefficient between in situ Chl-a and the three kinds of R rs λ
Fig. 6. Correlation between D3B and measured Chl-a
Fig. 7. Retrieval errors of the optimal statistical model X6 and 11 existing models
Fig. 8. In situ Chl-a versus estimated Chl-a of X6, OC2V4 and D3B in the two level Chl-a datasets
Fig. 9. Scatterplot of estimated and measured Chl-a value obtained from the leave-one-out procedure
Fig. 10. In situ Chl-a versus estimated Chl-a of X6, OC2V4, D3B and OC2-D3B in the all in situ datasets
Fig. 11. Spatial distribution of estimated Chl-a using the OC2V4, D3B, and OC2-D3B
Fig. 12. Estimated Chl-a versus in situ Chl-a of matchup samples
Fig. 13. Temporal variation of monthly average Chl-a concentration in wetland river water bodies from 2016 to 2019 and monthly average Chl-a concentration over the years
Fig. 14. The variation trend of Chl-a concentration with meteorological factors and correlation analysis
| ||||||||||||||||||||||||||||||||||||||||||||||||||||||||||||||||||
Table 1. Descriptive statistics of the concentration of water constituents in July 2018
|
Table 2. Brief descriptions of the 11 types of Chl-a retrieval algorithms used in this study
|
Table 3. The optimal fitting equation between reflectance and Chl-a concentration based on regression analysis
|
Table 4. Descriptive statistics of the water samples with D3B=-0.051 and Chl-a=4.5 mg/m3as hierarchical threshold

Set citation alerts for the article
Please enter your email address
© Copyright 2018-2021 | Chinese Laser Press. All Rights Reserved 沪ICP备15018463号-20