• Matter and Radiation at Extremes
  • Vol. 5, Issue 1, 018402 (2020)
David Walker1、* and Jie Li2
Author Affiliations
  • 1Lamont-Doherty Earth Observatory, Columbia University, Palisades New York 10964, USA
  • 2Earth and Environmental Sciences, University of Michigan, Ann Arbor Michigan 48109, USA
  • show less
    DOI: 10.1063/1.5129534 Cite this Article
    David Walker, Jie Li. Castable solid pressure media for multianvil devices[J]. Matter and Radiation at Extremes, 2020, 5(1): 018402 Copy Citation Text show less
    Ceramacast 646 pressure media for use in multianvil pressurizations. Dimensional abbreviations: TEL = truncated edge length of the triangular corner facet on a tungsten carbide anvil, which will mate to the pressure medium’s triangular octahedral face. GT = gasket thickness. EW = equatorial width. Regular octahedra of 10 mm and 8 mm EW without integral cast gaskets are for mating to 5 mm and 3 mm TEL anvils with COMPRES pyrophyllite gaskets.
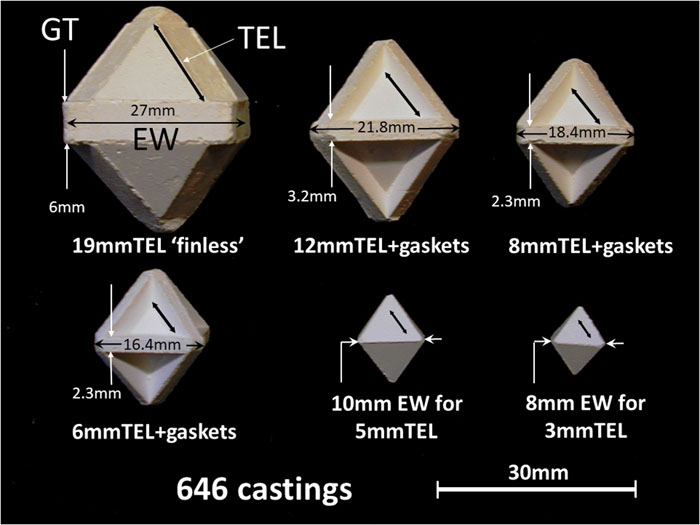
    Fig. 1. Ceramacast 646 pressure media for use in multianvil pressurizations. Dimensional abbreviations: TEL = truncated edge length of the triangular corner facet on a tungsten carbide anvil, which will mate to the pressure medium’s triangular octahedral face. GT = gasket thickness. EW = equatorial width. Regular octahedra of 10 mm and 8 mm EW without integral cast gaskets are for mating to 5 mm and 3 mm TEL anvils with COMPRES pyrophyllite gaskets.
    8 mm TEL Bi calibrations at room temperature. Ceramacast 646 (red, purple, blue, and pink) are compared with 584 (green and orange).
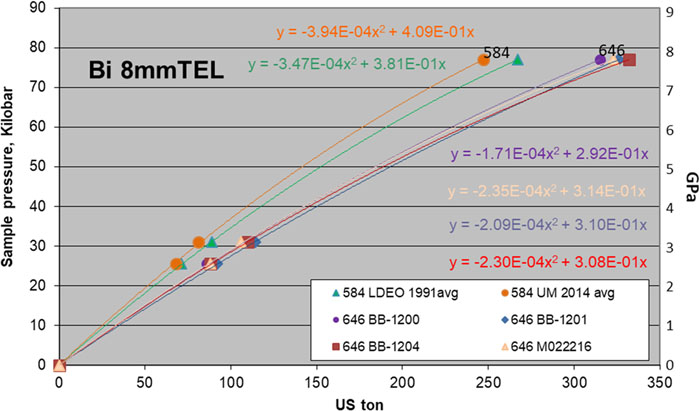
    Fig. 2. 8 mm TEL Bi calibrations at room temperature. Ceramacast 646 (red, purple, blue, and pink) are compared with 584 (green and orange).
    12 mm TEL Bi calibrations at room temperature. Ceramacast 646 (orange) is compared to 584 (green and purple).
    Fig. 3. 12 mm TEL Bi calibrations at room temperature. Ceramacast 646 (orange) is compared to 584 (green and purple).
    19 mm “finless” Bi calibrations at room temperature for Ceramacast 646.
    Fig. 4. 19 mm “finless” Bi calibrations at room temperature for Ceramacast 646.
    Summary of Bi calibrations at room temperature in Ceramacast 646.
    Fig. 5. Summary of Bi calibrations at room temperature in Ceramacast 646.
    High-temperature load-and-quench calibrations for CaGeO3 and SiO2 in 646. Abbreviations: quartz (qtz), coesite (coes), garnet (grt), perovskite (pvsk).
    Fig. 6. High-temperature load-and-quench calibrations for CaGeO3 and SiO2 in 646. Abbreviations: quartz (qtz), coesite (coes), garnet (grt), perovskite (pvsk).
    Raman spectra of starting materials and products of calibration experiments. The spectra were collected using a Renishaw Raman microscope, with 532 nm unpolarized laser light, a 50× objective (2 μm area) in the nonfocal mode, and an 1800 l/mm grating. The collection time ranged between 1 and 60 s. Results are shown without background subtraction.
    Fig. 7. Raman spectra of starting materials and products of calibration experiments. The spectra were collected using a Renishaw Raman microscope, with 532 nm unpolarized laser light, a 50× objective (2 μm area) in the nonfocal mode, and an 1800 l/mm grating. The collection time ranged between 1 and 60 s. Results are shown without background subtraction.
    CaGeO3 polymorphs wrapped in Pt display color differences: garnet is white, perovskite is tan/pink.
    Fig. 8. CaGeO3 polymorphs wrapped in Pt display color differences: garnet is white, perovskite is tan/pink.
    High temperature calibrations using Mg2SiO4 starting materials for 3 mm and 5 mm TEL octahedra with pyrophyllite gaskets. Data are found in Table III. The results of experiments using COMPRES injection molded octahedra (black symbols) are in good agreement with the black curves reproduced from Leinenweber et al.3 The results of experiments using 646 cast octahedra (red symbols) are used to constrain the red dashed curves. Circles denote two phases coexisting. Left- and right-pointing wedges denote single phases at higher tonnage or lower tonnage, respectively, than the relevant phase boundary at the experimental temperature. In experiment M080319, ringwoodite was the product at 715 tons and 1500 °C. The two red-filled wedges indicate that the tonnage was above that required for the rw/wd transition at 20.3 GPa and below that required for the rw/bm + pc transition at 23.3 GPa. Thus, sample pressure is greater than the 20.3 GPa needed for the rw/wd boundary and less than the 23.3 GPa needed to achieve the rw/bm + pc boundary. Abbreviations: forsterite (fo), wadsleyite (wd), ringwoodite (rw), bridgmanite (bm), periclase (pc).
    Fig. 9. High temperature calibrations using Mg2SiO4 starting materials for 3 mm and 5 mm TEL octahedra with pyrophyllite gaskets. Data are found in Table III. The results of experiments using COMPRES injection molded octahedra (black symbols) are in good agreement with the black curves reproduced from Leinenweber et al.3 The results of experiments using 646 cast octahedra (red symbols) are used to constrain the red dashed curves. Circles denote two phases coexisting. Left- and right-pointing wedges denote single phases at higher tonnage or lower tonnage, respectively, than the relevant phase boundary at the experimental temperature. In experiment M080319, ringwoodite was the product at 715 tons and 1500 °C. The two red-filled wedges indicate that the tonnage was above that required for the rw/wd transition at 20.3 GPa and below that required for the rw/bm + pc transition at 23.3 GPa. Thus, sample pressure is greater than the 20.3 GPa needed for the rw/wd boundary and less than the 23.3 GPa needed to achieve the rw/bm + pc boundary. Abbreviations: forsterite (fo), wadsleyite (wd), ringwoodite (rw), bridgmanite (bm), periclase (pc).
    Pressure calibrations of 8 mm TEL anvils based on the melting curve of NaCl. Black (584) and red (646) lines are linear fits to load-and-quench calibration experiments using SiO2 and CaGeO3 (Table III). Red circles and black squares represent pressures determined from the melting temperatures of NaCl (marked next to the 646 data points) at various press loads.
    Fig. 10. Pressure calibrations of 8 mm TEL anvils based on the melting curve of NaCl. Black (584) and red (646) lines are linear fits to load-and-quench calibration experiments using SiO2 and CaGeO3 (Table III). Red circles and black squares represent pressures determined from the melting temperatures of NaCl (marked next to the 646 data points) at various press loads.
    Thermal structure in 8 mm 646 assembly with LaCrO3 heater determined by two independent thermocouples 2 mm apart.
    Fig. 11. Thermal structure in 8 mm 646 assembly with LaCrO3 heater determined by two independent thermocouples 2 mm apart.
    Resistance of Bi as a function of press load for an 8 mm TEL octahedron with integral gaskets cast from 646 ceramic. Abrupt resistance changes correspond to phase changes between Bi polymorphs. Red dashed line is the initial linear slope of the Bi I–II transition. Yellow dashed trace, based on Bundy,14 is the theoretical trace if the transformations were instantaneous and without hysteresis. The real trace, BB-1200, taken over 17 h exhibits smearing of the Bi II stability to higher-than-equilibrium pressures.
    Fig. 12. Resistance of Bi as a function of press load for an 8 mm TEL octahedron with integral gaskets cast from 646 ceramic. Abrupt resistance changes correspond to phase changes between Bi polymorphs. Red dashed line is the initial linear slope of the Bi I–II transition. Yellow dashed trace, based on Bundy,14 is the theoretical trace if the transformations were instantaneous and without hysteresis. The real trace, BB-1200, taken over 17 h exhibits smearing of the Bi II stability to higher-than-equilibrium pressures.
    Shows the Bi calibrations of Fig. 5, except that Bi II–III, plotted as open symbols for the tonnage at the lowest point of the V valley, is plotted at 27 kbar instead of 31 kbar. It is clear that the open symbols fall systematically off and below the calibration curves shown here, which are based on fitting the standard values of Bi I–II = 25.5 kbar and Bi III–V = 77 kbar.
    Fig. 13. Shows the Bi calibrations of Fig. 5, except that Bi II–III, plotted as open symbols for the tonnage at the lowest point of the V valley, is plotted at 27 kbar instead of 31 kbar. It is clear that the open symbols fall systematically off and below the calibration curves shown here, which are based on fitting the standard values of Bi I–II = 25.5 kbar and Bi III–V = 77 kbar.
    Pressure → TEL25.5“31”77← Kilobars phase trans
    I-II4II-III2III-V4
    646 Bi calibrations
    BB-12486 mm5577222US ton
    BB-12048 mm88110332US ton
    BB-12008 mm86109315US ton
    BB-12018 mm92114326US ton
    M0222168 mm88106323US ton
    BB-120212 mm137173528US ton
    BB-1180a19 mm grit183242642US ton
    BB-118119 mm grit178227637US ton
    BB-118219 mm no grit188257651US ton
    584 Bi calibrations
    BB-14238 mm86109274US ton
    Walker '918 mm7189267US ton
    UM 20148 mm6881247US ton
    BB-412 mm old153183494US ton
    TT-96012 mm new107134420US ton
    Table 1. Room temperature Bi calibration in cast octahedra with integral fin gaskets.
    Serial no.TEL (mm)Heater°CUS tonPhaseP (GPa)
    SiO2 calibrations in 646
    BB-14048Ta1200144qtz3.2
    BB-14058Ta1200151qtz3.2
    M0712198Re1200150qtz+coes3.2
    BB-14068Ta1200164qtz+coes3.2
    M0715198Re1500169qtz+coes3.6
    BB-14088Ta1200181coes3.2
    BB-139212FeCrAl1100200qtz3.1
    BB-139312FeCrAl1100217qtz3.1
    BB-139412FeCrAl1200229qtz3.2
    BB-139112FeCrAl1100238qtz3.1
    BB-139512FeCrAl1200267qtz3.2
    BB-139012FeCrAl1100286coes3.1
    BB-138912FeCrAl1100312coes3.1
    CaGeO3 calibrations in 646
    GG-11916LCO1200177garnet6.0
    GG-11936LCO202pvsk6.0
    GG-11946LCO226pvsk6.0
    BB-12408LCO1200269garnet6.0
    M0307168Re/LCO1200273garnet6.0
    BB-14128Ta1200294garnet6.0
    BB-12378LCO1200295pvsk6.0
    M0229168Re/LCO1200298pvsk6.0
    BB-14138Ta1200318pvsk6.0
    BB-12388LCO1200338pvsk6.0
    BB-127112LCO1200433garnet6.0
    BB-127212LCO451garnet6.0
    TT-111312LCO478garnet6.0
    TT-111212LCO500pvsk6.0
    SiO2 calibrations in 584
    GG-728Re1200376coes+stish9.3
    M1024138Re1200347coes+stish9.3
    M0701138Re1200108qtz3.2
    CaGeO3 calibrations in 584
    M0730148Re1200213garn+pvsk6.0
    Table 2. High temperature SiO2 and CaGeO3 calibrations in cast octahedra with integral fin gaskets.a
    Experiment IDTELUS tonGPaT (C)ProductHeater
    646
    M0801195451<14.3111400foRe
    >20.311
    M0803193715<23.310∼1500rwRe
    COMPRES
    M0716195410<15.1111600foRe
    M0717195450>15.1111600wdRe
    M080819549617.1112200fo/wdLaCrO3
    M1013195714<21.0111600wdRe
    >20.511
    M0711153525<23.3101523rwRe
    M022819358823.1101600rw/bm+pcRe
    M0729133854>23.3101500bm+pcRe
    Table 3. High temperature Mg2SiO4 calibrations in finless octahedra with pyrophyllite gaskets.
    584 M100313646 M022219
    US tonMelting T (°C)NaCl (GPa)US tonMelting T (°C)NaCl (GPa)
    13112793.0100(1)1195(7)2.3
    16414464.8133(1)1313(4)3.3
    19715185.8169(1)1417(4)4.5
    23015776.7206(2)1495(7)5.5
    26316387.6245(2)1575(7)6.6
    29516828.4286(3)1637(18)7.6
    32817209.1328(2)1720(20)9.1
    Table 4. High temperature NaCl melting calibrations in octahedra with integral fin gaskets for 8 mm TEL WC anvils.a
    David Walker, Jie Li. Castable solid pressure media for multianvil devices[J]. Matter and Radiation at Extremes, 2020, 5(1): 018402
    Download Citation