• Journal of Natural Resources
  • Vol. 35, Issue 2, 343 (2020)
Kang WANG, Zhi-xue LI, and Jia ZHOU*
Author Affiliations
  • College of Geographical Science, Harbin Normal University, Harbin 150025, China
  • show less
    DOI: 10.31497/zrzyxb.20200208 Cite this Article
    Kang WANG, Zhi-xue LI, Jia ZHOU. The effects of environmental regulation on spatio-temporal carbon emissions patterns: Empirical analysis of prefecture-level cities in Northeast China[J]. Journal of Natural Resources, 2020, 35(2): 343 Copy Citation Text show less
    The proportion of investment in environmental pollution control in the three provinces of Northeast China as a proportion of GDP from 2005 to 2016
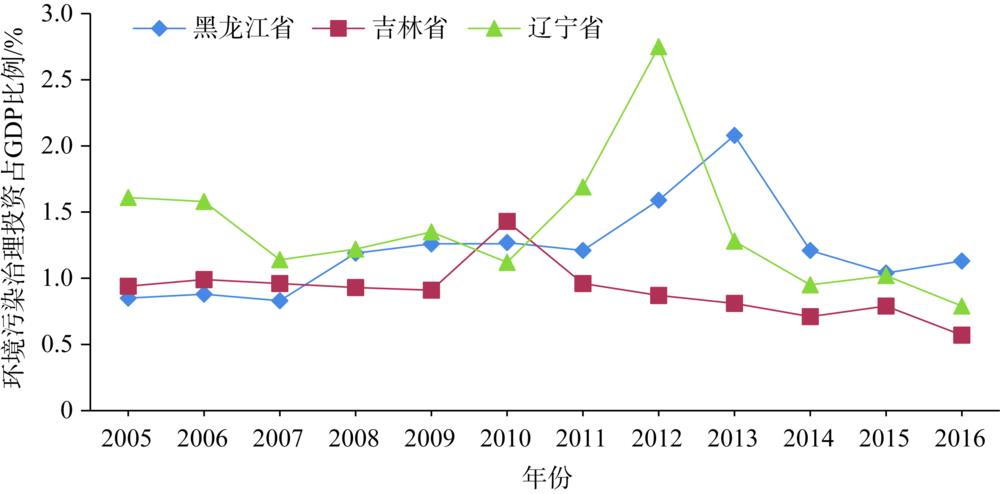
    Fig. 1. The proportion of investment in environmental pollution control in the three provinces of Northeast China as a proportion of GDP from 2005 to 2016
    The average scores of environmental regulations in various cities of Northeast China from 2005 to 2016
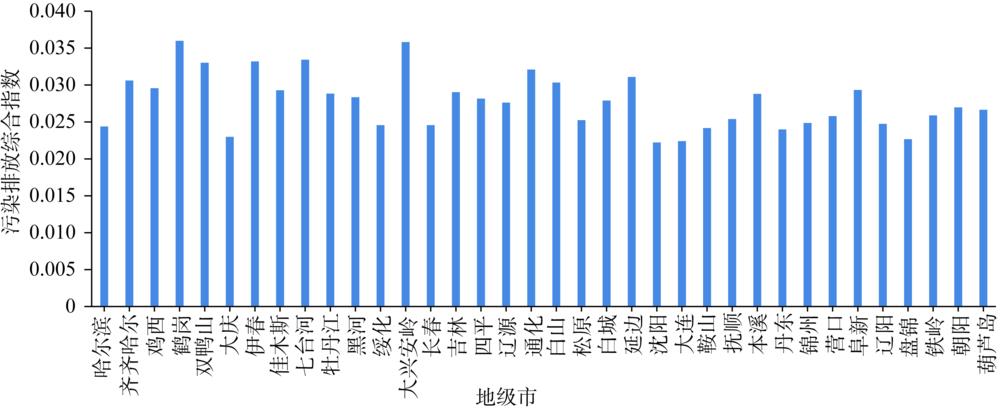
    Fig. 2. The average scores of environmental regulations in various cities of Northeast China from 2005 to 2016
    The total carbon emission trend of energy consumption in the three provinces of Northeast China in 2005-2016
    Fig. 3. The total carbon emission trend of energy consumption in the three provinces of Northeast China in 2005-2016
    Spatial pattern of environmental regulation intensity in the three provinces of Northeast China in 2005, 2009, 2012 and 2016
    Fig. 4. Spatial pattern of environmental regulation intensity in the three provinces of Northeast China in 2005, 2009, 2012 and 2016
    Spatial pattern of carbon emissions from energy consumption in the three provinces of Northeast China in 2005, 2009, 2012 and 2016
    Fig. 5. Spatial pattern of carbon emissions from energy consumption in the three provinces of Northeast China in 2005, 2009, 2012 and 2016
    碳源折标煤系数碳排放系数
    煤炭0.7143 t·t-10.7559
    焦炭0.9714 t·t-10.8556
    原油1.4286 t·t-10.5860
    汽油1.4714 t·t-10.5538
    煤油1.4714 t·t-10.5743
    柴油1.4574 t·t-10.5918
    燃料油1.4286 t·t-10.6182
    天然气1.33×10⁻³ t·m-30.4483
    Table 1. Contracted coal coefficient and carbon emission coefficient of main energy
    年份200520062007200820092010201120122013201420152016
    平均汇率8.2768.0707.8077.2996.8366.8286.6216.3016.2896.1426.2286.642
    Table 2. Average exchange rate of RMB to US dollar from 2005 to 2016
    变量模型(2)模型(3)
    lnClnFDIlnIND
    lnHGt-10.739***
    (4.58)
    1.437**
    (3.62)
    -0.317**
    (-1.62)
    lnGDP0.091**
    (0.79)
    1.052***
    (19.07)
    -0.043**
    (-1.54)
    lnCOP0.513***
    (3.21)
    0.507***
    (2.94)
    0.235**
    (2.27)
    常数项5.233***
    (5.13)
    6.253***
    (3.57)
    -2.45***
    (-2.81)
    Adj R-squared0.8910.8830.865
    F检验7.975***8.632***6.271***
    Hausman检验Prob>chi2
    =0.000
    Prob>chi2
    =0.000
    Prob>chi2
    =0.000
    Table 3. Model 2 and 3 regression results
    变量模型(4)模型(5)
    lnClnClnClnC
    lnHGt-10.708**
    (4.39)
    0.746**
    (4.47)
    ln(HGt--1×FDI)-0.038***
    (-0.61)
    ln(HGt-1×GDP)0.011***
    (0.53)
    lnGDP0.032**
    (0.11)
    0.012**
    (0.47)
    -0.037
    (-0.11)
    0.312**
    (0.67)
    lnCOP0.537***
    (3.61)
    0.483***
    (3.41)
    0.482***
    (3.32)
    0.507***
    (3.11)
    lnIND-0.153***
    (-3.32)
    lnFDI0.018***
    (0.53)
    常数项5.532***
    (5.17)
    5.72***
    (5.61)
    2.34**
    (3.35)
    3.27***
    (3.58)
    Adj R-squared0.8350.8540.8710.862
    F检验14.725***14.347***13.745***14.347***
    Hausman检验Prob>chi2=0.004Prob>chi2=0.000Prob>chi2=0.000Prob>chi2=0.000
    Table 4. Model 4 and 5 regression results
    Kang WANG, Zhi-xue LI, Jia ZHOU. The effects of environmental regulation on spatio-temporal carbon emissions patterns: Empirical analysis of prefecture-level cities in Northeast China[J]. Journal of Natural Resources, 2020, 35(2): 343
    Download Citation