
Kai HAI, Siyuan WANG, Yuanxu MA, Ruixia YANG, Ping TU, Juanzhu LIANG, Weihua LIU, Linlin WU. Urban expansion and form changes along the Belt and Road Initiative [J]. Acta Geographica Sinica, 2020, 75(10): 2092
- Acta Geographica Sinica
- Vol. 75, Issue 10, 2092 (2020)
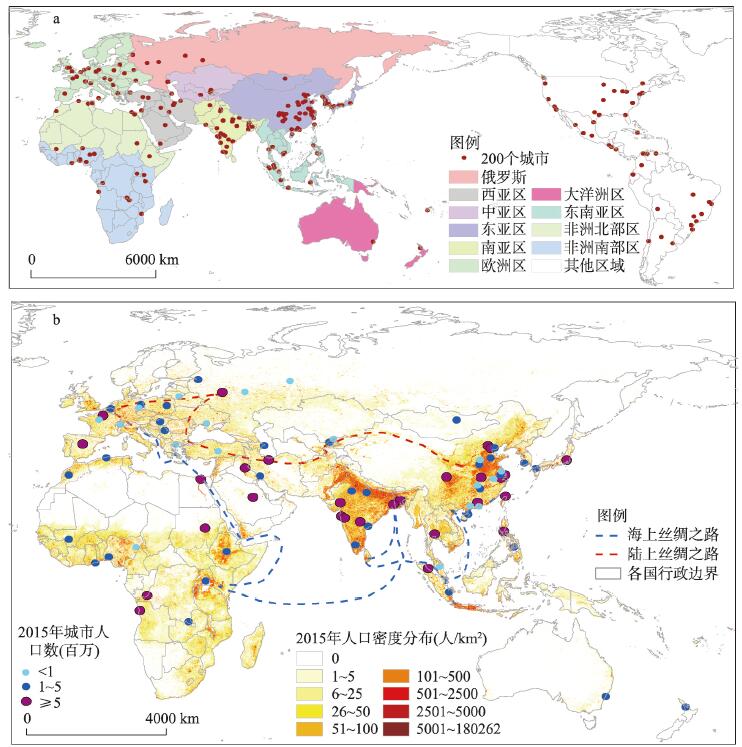
Fig. 1. Spatial distribution of 200 cities around the world (a) and 80 cities along the Belt and Road (b)
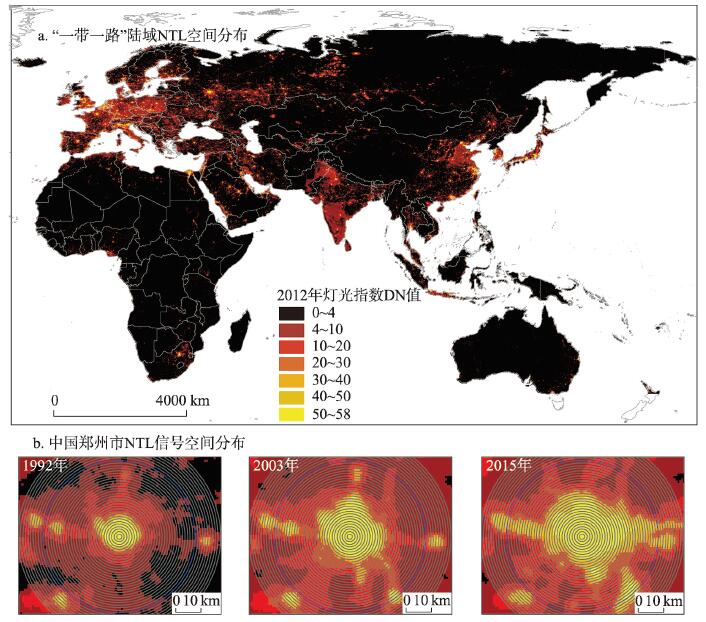
Fig. 2. Spatial distribution of intercalibrated nighttime lights along the Belt and Road (a), and the distribution of intercalibrated nighttime lightsin Zhengzhou, China (b)
Fig. 3. Division of 1 km concentric ring layer and spatial distribution of urban land in Zhengzhou, China
Fig. 4. Net increase in urban land along the Belt and Road from 1992 to 2015
Fig. 5. Inter-annual changes of urban land area in the ten major sub-regions from 1992 to 2015
Fig. 6. Fitting curves of urban land density functions in 1992, 2003 and 2015
Fig. 7. Box-plots of fitting parameters α c , and D of urban land density functions of different urban sizes in 1992, 2003 and 2015
Fig. 8. Fitting curves of urban land density functions of three different urban sizes along the Belt and Road
Fig. 9. Fitting curves of urban land density functions in the six sub-regions along the Belt and Road
Fig. 10. Statistics of kp for different urban sizes in 1992, 2003 and 2015
Fig. 11. Changes of main urban areas of different urban sizes from 1992 to 2003 and 2003 to 2015
Fig. 12. Comparison of the growth rates r 2 and r 1 for different urban sizes from 1992 to 2003 and 2003 to 2015
Fig. 13. Statistical relationship between the weighted lighting area and urban land area of 9 cities along the Belt and Road
Fig. 14. Statistical relationship between urban land area and urban population of 9 cities along the Belt and Road
Fig. 15. Comparative analysis of urban land area of ESA-CCI and GAIA in 1992, 2003 and 2015
| ||||||||||||||||||||||||||||||||||||||||||||||||||||||
Table 1. Statistical regression analysis of urban land area, urban population and weighted lighting area along the Belt and Road


Set citation alerts for the article
Please enter your email address

© Copyright 2018-2021 | Chinese Laser Press. All Rights Reserved 沪ICP备15018463号-20