• Resources Science
  • Vol. 42, Issue 8, 1515 (2020)
Min HAO1、2、3, Weiqiang CHEN1、2、3、*, Zijie MA1、2、3, Chao ZHANG4, and Jianbang GAN5
Author Affiliations
  • 1Key Lab of Urban Environment and Health, Institute of Urban Environment, CAS, Xiamen 361021, China
  • 2University of Chinese Academy of Sciences, Beijing 100049, China
  • 3Xiamen Key Lab of Urban Metabolism, Xiamen 361021, China
  • 4College of Economics and Management, Tongji University, Shanghai 200092, China
  • 5Department of Ecology and Conservation Biology, Texas A&M University, College Station, TX 77843, USA
  • show less
    DOI: 10.18402/resci.2020.08.07 Cite this Article
    Min HAO, Weiqiang CHEN, Zijie MA, Chao ZHANG, Jianbang GAN. Benefits and risks of China’s copper waste and scrap trade during 2000-2015[J]. Resources Science, 2020, 42(8): 1515 Copy Citation Text show less
    Change of refined copper production,1950-2015 (a) and sources of reclaimed copper smelting raw materials, 2000-2015 (b) in China
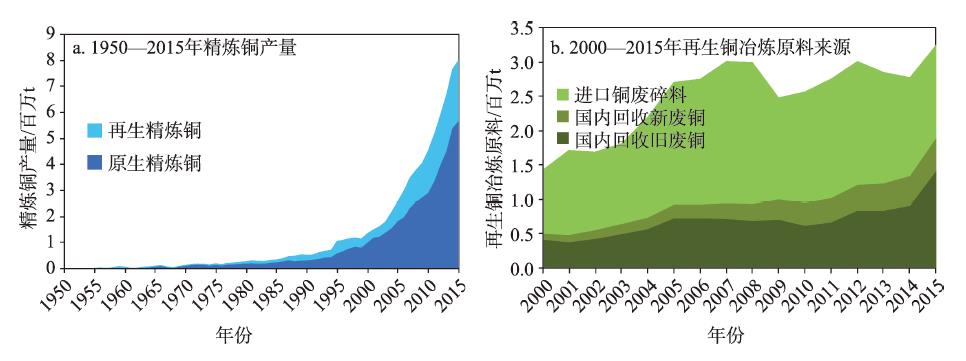
    Fig. 1. Change of refined copper production,1950-2015 (a) and sources of reclaimed copper smelting raw materials, 2000-2015 (b) in China
    Consumption gap of refined copper and net import structure of copper in China, 2000-2015
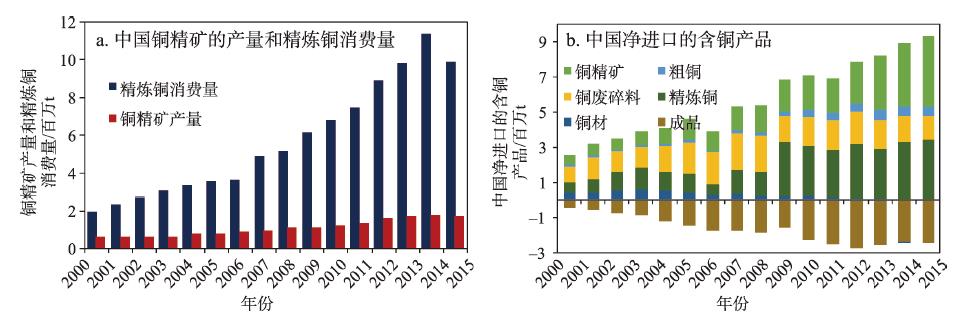
    Fig. 2. Consumption gap of refined copper and net import structure of copper in China, 2000-2015
    System boundary of this study and the life cycle of copper production in the socioeconomic system
    Fig. 3. System boundary of this study and the life cycle of copper production in the socioeconomic system
    China’s import and export volume of copper waste and scrap, 2000-2015
    Fig. 4. China’s import and export volume of copper waste and scrap, 2000-2015
    Sketch map of countries/regions of China’s copper waste and scrap trade, 2015
    Fig. 5. Sketch map of countries/regions of China’s copper waste and scrap trade, 2015
    Material flow balance of cumulative refined copper production in China, 2000-2015 (unit: 104 t)
    Fig. 6. Material flow balance of cumulative refined copper production in China, 2000-2015 (unit: 104 t)
    China’s saved mining investment cost and unit price of imported copper waste and scrap, refined copper, and copper concentrate, 2000-2015
    Fig. 7. China’s saved mining investment cost and unit price of imported copper waste and scrap, refined copper, and copper concentrate, 2000-2015
    Dismantling site of a low grade copper waste and scrap dismantling enterprise in Qingyuan City, Guangdong Province
    Fig. 8. Dismantling site of a low grade copper waste and scrap dismantling enterprise in Qingyuan City, Guangdong Province
    环境影响指标简称单位影响范围相关的环境因素
    非生物性资源消耗ADPMJ eq全球采矿消耗、化石燃料的消耗、
    酸化潜力APkg SO2 eq区域SO2,NOX,HCl,HF,等
    富营养化潜力EPkg PO4 eq区域氨、磷酸盐、硝酸盐等
    全球变暖潜力GWPkg CO2 eq全球CO2、NO2、CH4、CF6、CH3Br、卤代有机物等
    人体毒性潜力HTPkg 1,4 DB eq当地进入大气、土壤、水体的有毒物质:As、Cd、Cr、Hg、Ni、Pb、V、二恶英
    光化学臭氧生成潜力POCPkg C2H4 eq区域乙烯、非甲烷烃类(NMHC)等
    Table 1. Environmental impact indicators and related environmental factors
    环境影响指标单位原生铜EIkP再生铜EIkS环境效益Sk
    非生物性资源消耗MJ eq34154.617333.6226820.99
    酸化潜力kg SO2 eq20.361.3818.98
    富营养化潜力kg PO4 eq1.190.220.97
    全球变暖潜力kg CO2 eq3417.52315.953101.57
    人体毒性潜力kg 1,4 DB eq1785.72219.721566.00
    光化学臭氧生成潜力kg C2H4 eq1.440.131.31
    Table 2. Environmental effects of the refined and reclaimed copper production
    Min HAO, Weiqiang CHEN, Zijie MA, Chao ZHANG, Jianbang GAN. Benefits and risks of China’s copper waste and scrap trade during 2000-2015[J]. Resources Science, 2020, 42(8): 1515
    Download Citation