• Chinese Optics Letters
  • Vol. 16, Issue 10, 103202 (2018)
Xulei Ge1、2、3, Xiaohui Yuan2、3、*, Yuan Fang2、3, Wenqing Wei2、3, Su Yang2、3, Feng Liu2、3、**, Min Chen2、3, Li Zhao1, Zhengming Sheng2、3、4, and Jie Zhang2、3
Author Affiliations
  • 1State Key Laboratory of Surface Physics and Department of Physics, Fudan University, Shanghai 200433, China
  • 2Key Laboratory for Laser Plasmas (MoE) and School of Physics and Astronomy, Shanghai Jiao Tong University, Shanghai 200240, China
  • 3Collaborative Innovation Center of IFSA (CICIFSA), Shanghai Jiao Tong University, Shanghai 200240, China
  • 4SUPA, Department of Physics, University of Strathclyde, Glasgow G4 0NG, United Kingdom
  • show less
    DOI: 10.3788/COL201816.103202 Cite this Article Set citation alerts
    Xulei Ge, Xiaohui Yuan, Yuan Fang, Wenqing Wei, Su Yang, Feng Liu, Min Chen, Li Zhao, Zhengming Sheng, Jie Zhang. Pulse shape of ultrashort intense laser reflected from a plasma mirror[J]. Chinese Optics Letters, 2018, 16(10): 103202 Copy Citation Text show less
    (a) Schematic of the experimental setup. Two identical off-axis parabola mirrors, OAP1 and OAP2, are used to focus and recollimate the laser beam. The laser pulse temporal profiles are measured with SHG-FROG and Sequoia. W1, W2 are wedged fused silica plates, and M1–M4 are HR mirrors. M2 is mounted on a motorized linear stage. PM stands for plasma mirror. (b) The laser contrast measurement in a 60 ps window using Sequoia. The inset is the zoom-in profile from −1 to 0.5 ps. The ‘a’ and ‘b’ correspond to the estimated PM trigger times for laser fluences Fpm of 140.0 J/cm2 and 6.5 J/cm2, respectively. Example results of (c) retrieved FROG trace and (d) the corresponding Wigner distribution of laser pulse without a PM.
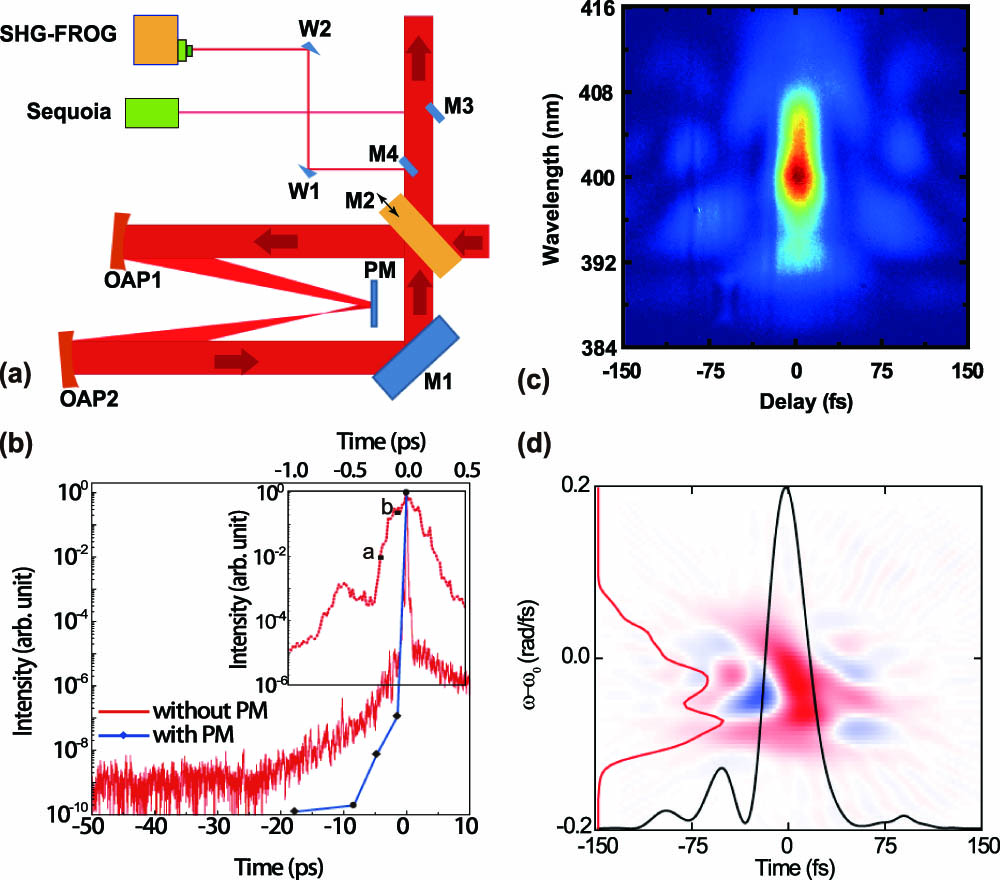
    Fig. 1. (a) Schematic of the experimental setup. Two identical off-axis parabola mirrors, OAP1 and OAP2, are used to focus and recollimate the laser beam. The laser pulse temporal profiles are measured with SHG-FROG and Sequoia. W1, W2 are wedged fused silica plates, and M1–M4 are HR mirrors. M2 is mounted on a motorized linear stage. PM stands for plasma mirror. (b) The laser contrast measurement in a 60 ps window using Sequoia. The inset is the zoom-in profile from 1 to 0.5 ps. The ‘a’ and ‘b’ correspond to the estimated PM trigger times for laser fluences Fpm of 140.0J/cm2 and 6.5J/cm2, respectively. Example results of (c) retrieved FROG trace and (d) the corresponding Wigner distribution of laser pulse without a PM.
    Wigner distribution (left axis) and temporal profiles (right axis) of the laser pulse after reflection from the PM with Fpm equal to (a) 140.0 J/cm2, (b) 50.0 J/cm2, (c) 23.8 J/cm2, (d) 14.0 J/cm2, (e) 9.2 J/cm2, and (f) 6.5 J/cm2. The intensity is normalized to the peak value at t=0 fs. The shaded area in each plot is due to the shot-to-shot fluctuations.
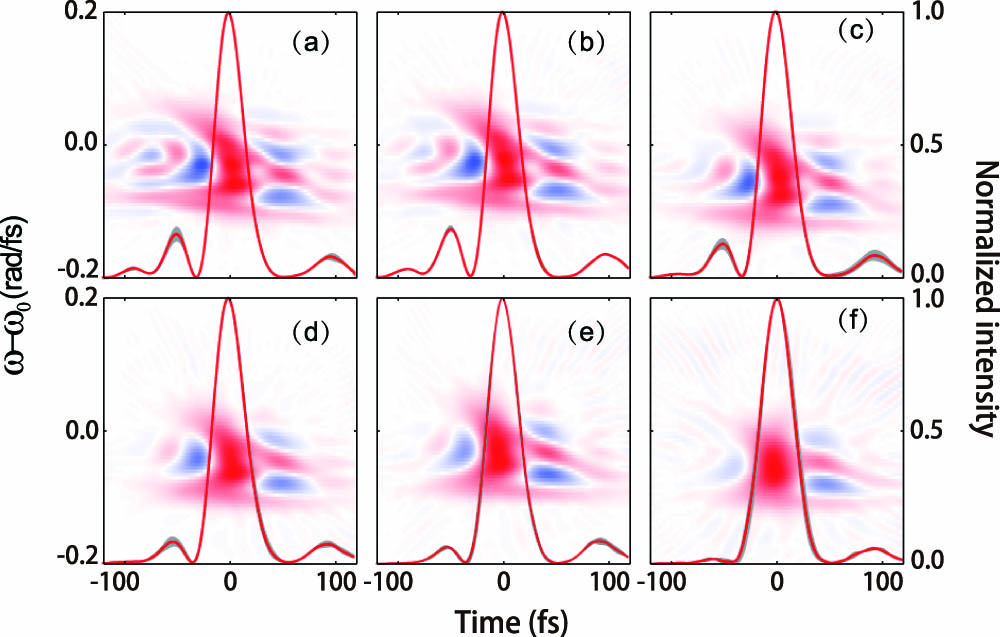
    Fig. 2. Wigner distribution (left axis) and temporal profiles (right axis) of the laser pulse after reflection from the PM with Fpm equal to (a) 140.0J/cm2, (b) 50.0J/cm2, (c) 23.8J/cm2, (d) 14.0J/cm2, (e) 9.2J/cm2, and (f) 6.5J/cm2. The intensity is normalized to the peak value at t=0fs. The shaded area in each plot is due to the shot-to-shot fluctuations.
    (a) Pulse durations measured with FWHM (TFWHM) and the second-order moment (Tvar) methods. The solid lines are drawn to guide eyes. (b) Integrated reflectivity of the PM-reflected laser pulse as a function of Fpm.
    Fig. 3. (a) Pulse durations measured with FWHM (TFWHM) and the second-order moment (Tvar) methods. The solid lines are drawn to guide eyes. (b) Integrated reflectivity of the PM-reflected laser pulse as a function of Fpm.
    Retrieved spectral intensity (red line) and phase (black line) of the PM-reflected laser beam with the same laser fluence as in Fig. 2. The shaded area in each plot is due to shot-to-shot fluctuations.
    Fig. 4. Retrieved spectral intensity (red line) and phase (black line) of the PM-reflected laser beam with the same laser fluence as in Fig. 2. The shaded area in each plot is due to shot-to-shot fluctuations.
    Modulation depth Γ (black line) and group delay t (red line) for two laser fluence examples of (a) Fpm=50.0 J/cm2 and (b) Fpm=9.2 J/cm2. The dashed lines are the reference group delays for the laser pulse without a PM. The shaded areas are the standard deviations due to shot-to-shot fluctuations.
    Fig. 5. Modulation depth Γ (black line) and group delay t (red line) for two laser fluence examples of (a) Fpm=50.0J/cm2 and (b) Fpm=9.2J/cm2. The dashed lines are the reference group delays for the laser pulse without a PM. The shaded areas are the standard deviations due to shot-to-shot fluctuations.
    Xulei Ge, Xiaohui Yuan, Yuan Fang, Wenqing Wei, Su Yang, Feng Liu, Min Chen, Li Zhao, Zhengming Sheng, Jie Zhang. Pulse shape of ultrashort intense laser reflected from a plasma mirror[J]. Chinese Optics Letters, 2018, 16(10): 103202
    Download Citation