• Chinese Journal of Lasers
  • Vol. 48, Issue 18, 1802007 (2021)
Jinzhao Liu, Tingyan Yan, Xufeng Kang, and Xiaohong Zhan*
Author Affiliations
  • College of Materials Science and Technology, Nanjing University of Aeronautics and Astronautics, Nanjing, Jiangsu 211106, China
  • show less
    DOI: 10.3788/CJL202148.1802007 Cite this Article Set citation alerts
    Jinzhao Liu, Tingyan Yan, Xufeng Kang, Xiaohong Zhan. Influence of Laser Power on Fracture Properties of TC4 Titanium Alloy T-Joint Manufactured Using Dual-Laser-Beam Bilateral Synchronous Welding[J]. Chinese Journal of Lasers, 2021, 48(18): 1802007 Copy Citation Text show less
    Schematic diagrams of skin-stringer structure dimension and dual-laser-beam bilateral synchronous welding. (a)(b) Schematic diagrams of skin-stringer structure dimension; (c) schematic diagram of dual-laser-beam bilateral synchronous welding
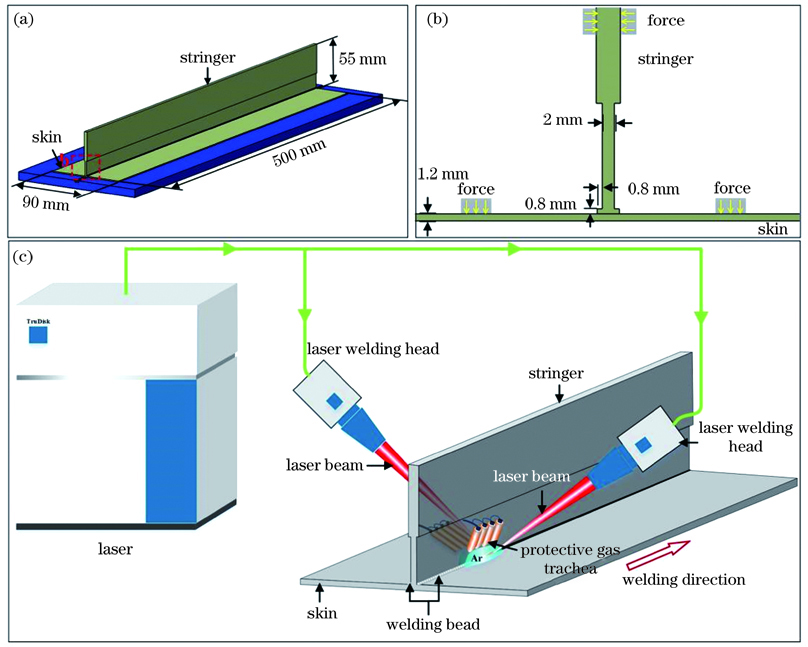
    Fig. 1. Schematic diagrams of skin-stringer structure dimension and dual-laser-beam bilateral synchronous welding. (a)(b) Schematic diagrams of skin-stringer structure dimension; (c) schematic diagram of dual-laser-beam bilateral synchronous welding
    Equipment of DLBSW. (a) Motion system; (b) Trudisk 12003 laser; (c) laser welding head
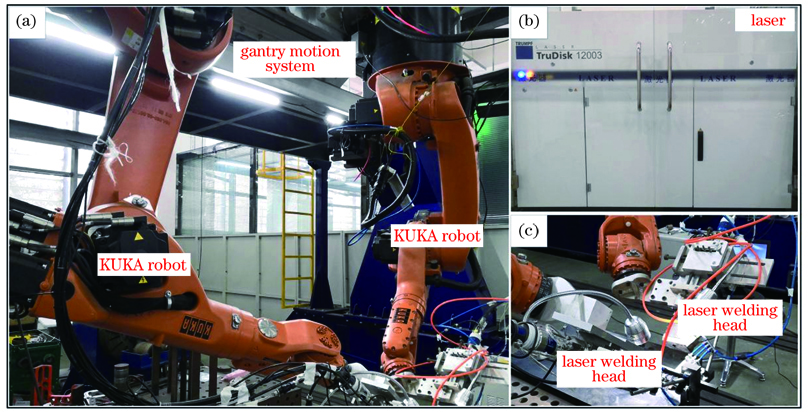
    Fig. 2. Equipment of DLBSW. (a) Motion system; (b) Trudisk 12003 laser; (c) laser welding head
    Sampling position and dimension of the tensile specimen. (a) Sampling position of the tensile specimen; (b) dimension of the tensile specimen
    Fig. 3. Sampling position and dimension of the tensile specimen. (a) Sampling position of the tensile specimen; (b) dimension of the tensile specimen
    Macroscopical formation of the welding bead of DLBSW. (a) No.1 specimen, P=2.1 kW; (b) No.2 specimen, P=2.3 kW
    Fig. 4. Macroscopical formation of the welding bead of DLBSW. (a) No.1 specimen, P=2.1 kW; (b) No.2 specimen, P=2.3 kW
    Cross sections of titanium alloy DLBSW joint. (a) No.1 specimen, P=2.1 kW; (b) No.2 specimen, P=2.3 kW
    Fig. 5. Cross sections of titanium alloy DLBSW joint. (a) No.1 specimen, P=2.1 kW; (b) No.2 specimen, P=2.3 kW
    Microstructures in different regions of No. 1 specimen. (a) Joint cross section; (b) upper transition region; (c) upper fine grain region and coarse grain region; (d) lower transition region; (e) welding bead region; (f) near lower fusion line
    Fig. 6. Microstructures in different regions of No. 1 specimen. (a) Joint cross section; (b) upper transition region; (c) upper fine grain region and coarse grain region; (d) lower transition region; (e) welding bead region; (f) near lower fusion line
    Microstructures in different regions of No. 2 specimen. (a) Joint cross section; (b) upper transition region; (c) upper fine grain region and coarse grain region; (d) welding bead region; (e) near lower fusion line; (f) lower transition region
    Fig. 7. Microstructures in different regions of No. 2 specimen. (a) Joint cross section; (b) upper transition region; (c) upper fine grain region and coarse grain region; (d) welding bead region; (e) near lower fusion line; (f) lower transition region
    Macro fracture diagrams of titanium alloy T-joint. (a) No.1 specimen, P=2.1 kW; (b) No.2 specimen, P=2.3 kW
    Fig. 8. Macro fracture diagrams of titanium alloy T-joint. (a) No.1 specimen, P=2.1 kW; (b) No.2 specimen, P=2.3 kW
    Z-direction tensile stress-strain curves of titanium alloy T-joint. (a) No.1 specimen, P=2.1 kW; (b) No.2 specimen, P=2.3 kW
    Fig. 9. Z-direction tensile stress-strain curves of titanium alloy T-joint. (a) No.1 specimen, P=2.1 kW; (b) No.2 specimen, P=2.3 kW
    Macro and micro morphology of fracture surface of No. 1 sample. (a) Macro morphology of fracture surface; (b) equiaxed dimple; (c) elongated dimple
    Fig. 10. Macro and micro morphology of fracture surface of No. 1 sample. (a) Macro morphology of fracture surface; (b) equiaxed dimple; (c) elongated dimple
    Macro and micro morphology of fracture surface of No. 2 sample. (a) Equiaxed dimples; (b) exfoliated α' phase interface; (c) porosity defects; (d) EDS results
    Fig. 11. Macro and micro morphology of fracture surface of No. 2 sample. (a) Equiaxed dimples; (b) exfoliated α' phase interface; (c) porosity defects; (d) EDS results
    CompositionFeCHONAlVTi
    Mass fraction≤0.30≤0.10≤0.015≤0.20≤0.055.5--6.83.5--4.5Bal.
    Table 1. Chemical composition of TC4 titanium alloy unit: %
    MaterialTensile strength /MPaYield strength /MPaElongation /%
    Ti6Al4V alloy8958358.2
    Table 2. Mechanical properties of TC4 titanium alloy
    No.Laser power /kWWelding speed /(mm·s-1)Laser incident angle /(°)Defocus quantity /mm
    12.122400
    22.322400
    Table 3. Experimental parameters of DLBSW of TC4 titanium alloy
    Jinzhao Liu, Tingyan Yan, Xufeng Kang, Xiaohong Zhan. Influence of Laser Power on Fracture Properties of TC4 Titanium Alloy T-Joint Manufactured Using Dual-Laser-Beam Bilateral Synchronous Welding[J]. Chinese Journal of Lasers, 2021, 48(18): 1802007
    Download Citation