• Journal of Geo-information Science
  • Vol. 22, Issue 10, 1983 (2020)
Jiadan DONG1, Xiaoling CHEN1, Xiaobin CAI2, Qiangqiang XU1, Yuting GUAN1, Tinghui LI1, Shiyan LIU2, and Fang CHEN1、*
Author Affiliations
  • 1State Key Laboratory of Information Engineering in Surveying, Mapping and Remote Sensing, Wuhan University, Wuhan 430079, China
  • 2Institute of Geodesy and Geophysics, Chinese Academy of Sciences, Wuhan 430077, China
  • show less
    DOI: 10.12082/dqxxkx.2020.200212 Cite this Article
    Jiadan DONG, Xiaoling CHEN, Xiaobin CAI, Qiangqiang XU, Yuting GUAN, Tinghui LI, Shiyan LIU, Fang CHEN. Analysis of the Temporal and Spatial Variation of Atmospheric Quality from 2015 to 2019 based on China Atmospheric Environment Monitoring Station[J]. Journal of Geo-information Science, 2020, 22(10): 1983 Copy Citation Text show less
    Map of air quality monitoring stations in China from 2015 to 2019
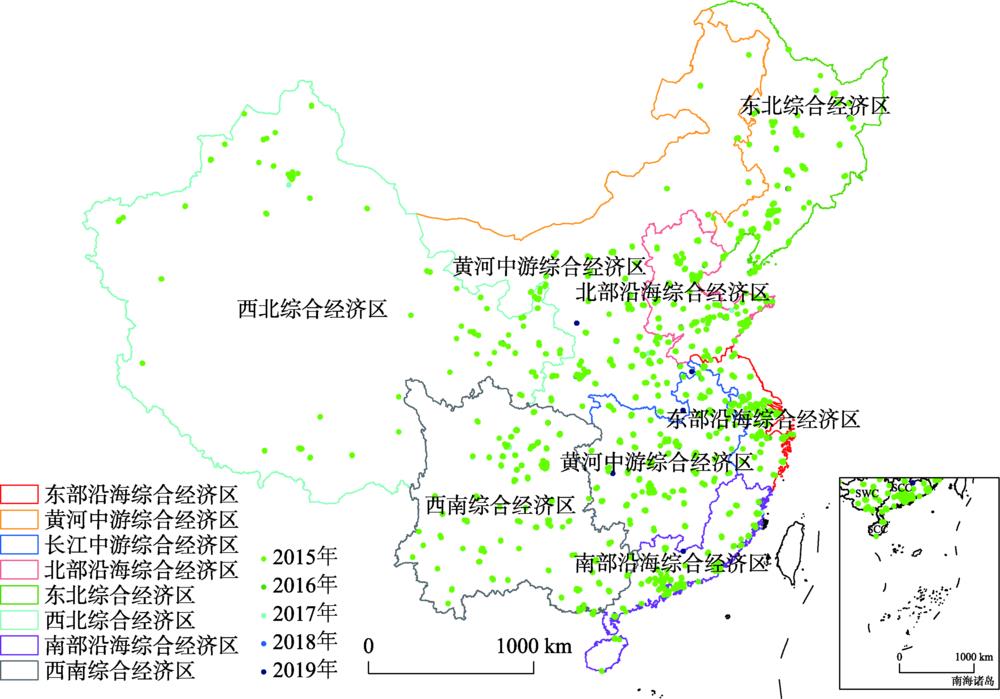
    Fig. 1. Map of air quality monitoring stations in China from 2015 to 2019
    Average mass concentration of six key atmospheric pollutants and AQI in China from 2015 to 2019
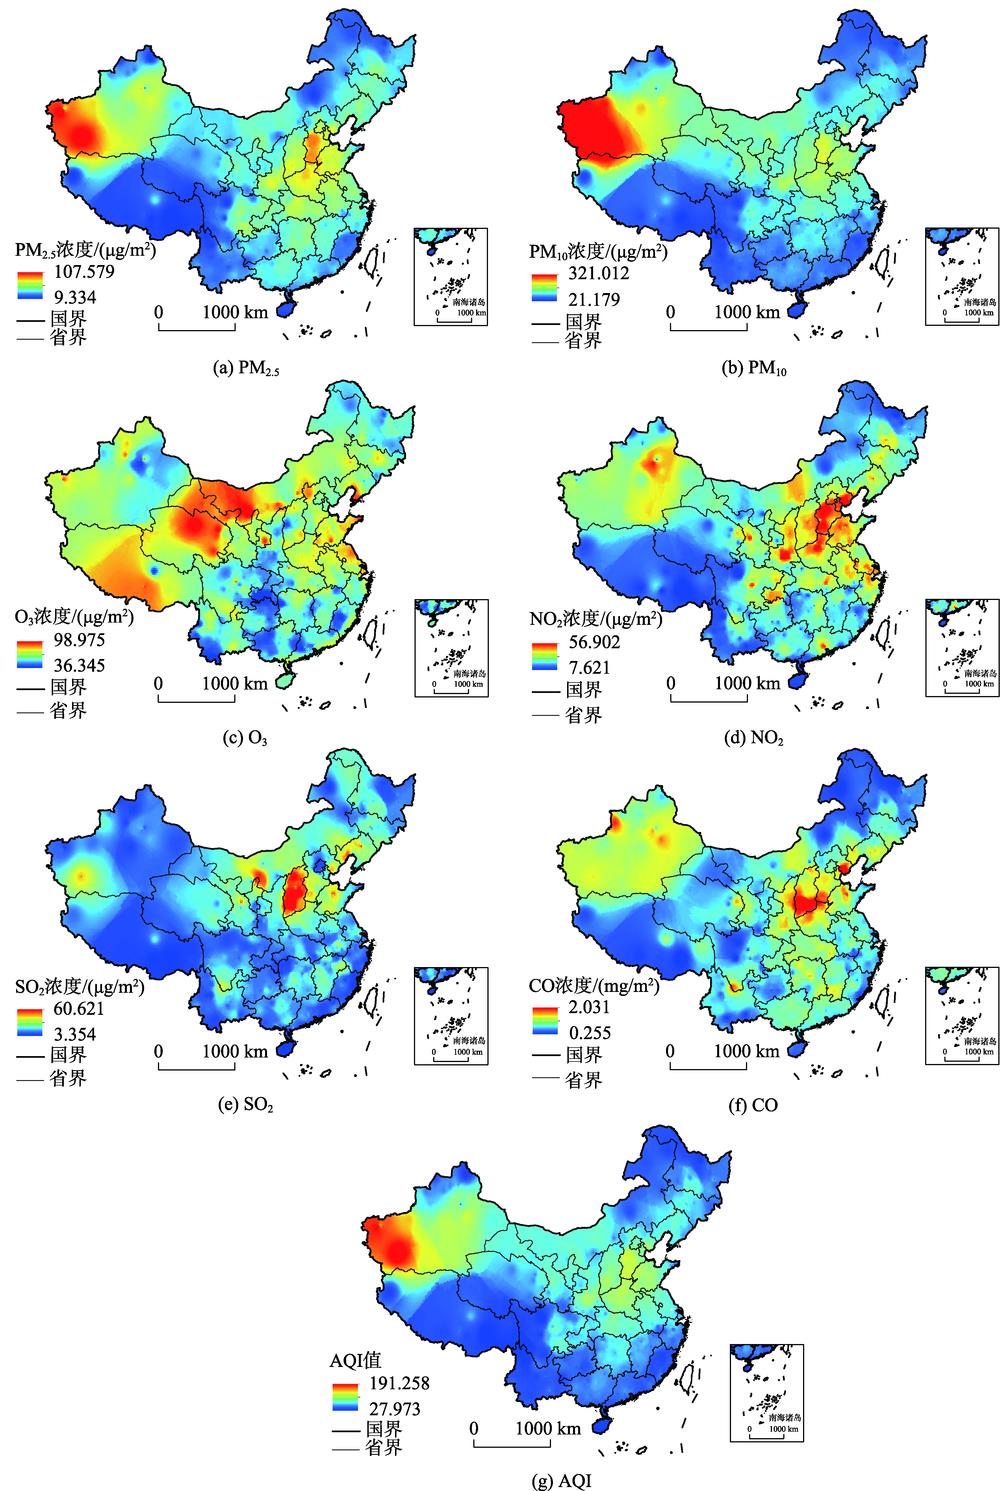
    Fig. 2. Average mass concentration of six key atmospheric pollutants and AQI in China from 2015 to 2019
    Monthly average mass concentration changes of six key atmospheric pollutantsand AQI from 2015 to 2019
    Fig. 3. Monthly average mass concentration changes of six key atmospheric pollutantsand AQI from 2015 to 2019
    Seasonal average mass concentration changes of six key atmospheric pollutants and AQI from 2015 to 2019
    Fig. 4. Seasonal average mass concentration changes of six key atmospheric pollutants and AQI from 2015 to 2019
    Seasonal average changes of four combination indexes of key atmospheric pollutants in China from 2015 to 2019
    Fig. 5. Seasonal average changes of four combination indexes of key atmospheric pollutants in China from 2015 to 2019
    Monthly Changes of four types of weather data in China from 2015 to 2019
    Fig. 6. Monthly Changes of four types of weather data in China from 2015 to 2019
    PM2.5/PM10PM2.5/COPM2.5/SO2SO2/NO2
    东北区0.57443.1892.1500.723
    北部区0.61153.4413.3900.471
    东部区0.63852.9973.3320.388
    南部区0.60033.4832.7930.478
    黄中区0.51843.6472.1880.778
    长中区0.62646.9033.0600.605
    西南区0.60440.1972.5840.551
    西北区0.39544.8712.5150.667
    中国北方0.54045.7602.5170.690
    中国南方0.60144.3382.8350.533
    Table 1. Comparison of the combined ratios of four key atmospheric pollutants in eight major comprehensive economic zones from 2015 to 2019
    COSO2NO2O3PM10PM2.5
    CO10.950**0.822**-0.846**0.741**0.955**
    SO20.950**10.718**-0.729**0.707**0.895**
    NO20.822**0.718**1-0.828**0.799**0.879**
    O3-0.846**-0.729**-0.828**1-0.581**-0.815**
    PM100.741**0.707**0.799**-0.581**10.861**
    PM2.50.955**0.895**0.879**-0.815**0.861**1
    Table 2. Correlation coefficients of key atmospheric pollutants in China from 2015 to 2019
    Jiadan DONG, Xiaoling CHEN, Xiaobin CAI, Qiangqiang XU, Yuting GUAN, Tinghui LI, Shiyan LIU, Fang CHEN. Analysis of the Temporal and Spatial Variation of Atmospheric Quality from 2015 to 2019 based on China Atmospheric Environment Monitoring Station[J]. Journal of Geo-information Science, 2020, 22(10): 1983
    Download Citation