Weiyi XU, Xiaobin JIN, Jing LIU, Yinkang ZHOU. Impact of cultivated land fragmentation on spatial heterogeneity of agricultural agglomeration in China[J]. Journal of Geographical Sciences, 2020, 30(10): 1571
Copy Citation Text
Systematically revealing the impact of cultivated land fragmentation (CLF) on the geographical agglomeration pattern of agricultural specialization (AS) has positive significance for national agricultural production management. Based on the data of the second national land survey and agricultural production, this study has explored the impact of CLF on spatial heterogeneity of agricultural agglomeration in China by comprehensively using the Theil index, ordinary least square model and geographically weighted regression. Results showed that: (1) the regional differentiation of the CLF in China is obvious, and the cultivated land fragmentation index is generally characterized by increasing pattern from northwest to southeast. (2) Spatially, the development level of AS in China has formed three high-value clusters in the Northeast China Plain, the Qinghai-Tibet Plateau, and the middle of the Middle-lower Yangtze Plain; and the low-value contiguous areas centered on the Yunnan-Guizhou Plateau and the Sichuan Basin and surrounding regions, with significant spatial differences. The contribution of grain crops, economic crops, and vegetables and melon to the level of AS was 74.63%, 9.09%, and 16.28%, respectively, and the pattern of agricultural geographical aggregation dominated by grain crops has primarily taken in shape. (3) CLF is significantly negatively correlated with AS, and every 1% increase in the degree of CLF will result in a decrease of about 0.2% in AS. However, the impact of CLF on the geographic agglomeration of different crop categories or groups varies significantly. Among them, CLF has a prominent impact on the specialization level of grain crops and vegetables and melon. Each 1% increase in the CLF will reduce the specialization level of grain crops by 0.38%, and increase the level of vegetables and melon by about 0.22%. (4) According to the landscape characteristics of cultivated land, the degree of spatial division and agglomeration of cultivated land patches have a significant impact on the formation of geographical agglomeration pattern of AS, and the intensity and direction of influence show significant regional differentiation, while the patch size has no significant impact.
The special land distribution system and the basic national conditions with more people and less land and uneven distribution of resources determine that the phenomenon of cultivated land fragmentation (CLF) will exist in China for a long time and will have an important impact on China’s agricultural development (Liu et al., 2019a). Especially in the current background of small-scale peasant economy, the fragmented cultivated land utilization pattern has hindered the development of modern agriculture to a certain extent, resulting in the decline of agricultural production efficiency and the weakness of international competitiveness. Although a certain degree of CLF plays a positive role in reducing the agricultural production risk and enriching the structure of agricultural planting (Liu et al., 2019b).
Practices of agricultural development in developed countries show that the specialization of agricultural land use based on regional comparative advantages is the essential feature and important symbol of agricultural modernization (Wang and Zhu, 2017). The specialization of agricultural land use, which is characterized by the transformation of agricultural land use types in a specific region from diversification to simplification and from decentralization to centralization (Wang and Zhu, 2018), is conducive to breaking through the restriction of the operation scale of individual farmers and establishing the geographical symbol of agriculture, thereby achieving economies of scale and division of labor and improving the international competitiveness of agriculture (Chen et al., 2013). Presently, the use of agricultural land in major developed countries such as the United States, France, Japan, and the United Kingdom has been generally specialized (Chen et al., 2013; Wang and Zhu, 2018), and a variety of agricultural products specialized planting or production areas have been formed, such as the corn belt in the north-central United States and the cotton belt in the south, the grain planting belt in Paris Basin of France and grape planting and processing belt in Champagne, etc. Conversely, owing to the interactive effects (Hartvigsen, 2014; Liu et al., 2019a) of natural environment characteristics, resource endowments, economic strategies, and cultural tradition, the fragmented pattern of cultivated land use and the traditional agricultural management mode dominated by peasant households and characterized by small-scale and scattered have led to a certain degree of slow development of China’s agricultural land-use specialization and modern agriculture. Therefore, clarifying the spatial differentiation characteristics of CLF and agricultural specialization (AS) in China and the impact of CLF on AS can provide helpful information for advancing the development of agricultural specialization and modernization.
As a successful spatial organization form of resource elements, AS has become the backbone of promoting regional and national agricultural development, and has been widely concerned by the international community. Schultz, an American economist and Nobel laureate in economics, paid attention to the regional division and specialization of agriculture earlier (Schultz, 1951). Scholars such as Krugman (1991) and Porter (1998) demonstrated the critical role of planting industry specialization in increasing income and cluster competition from the perspective of improving regional competitiveness and meeting the challenges of globalization. Klasen et al. (2016) and de Roest et al. (2018) had discussed the trade-offs between economic benefits and ecosystem functions of agricultural specialization, and the differential effects of specialized economies of scale and diversified economies of scope on agricultural development paths based on the differences in spatial scale. On the whole, scholars around the world have discussed the pattern, process, impact and significance of AS in terms of spatial differences, influencing factors, evolutionary trends and economic effects, and its internal relations with agriculture transformation (Shahe and Shilpi, 2007; Minten et al., 2013; Wang and Zhu, 2017; Wang and Zhu, 2018; Yang et al., 2018). The research objects of AS are mostly focused on a specific specialized agglomeration area or village of planting industry, such as the mushroom industry chain in Xixia County of Henan Province (Wu et al., 2017) and the vegetable industry cluster of Shouguang in Shandong Province (Zhou et al., 2012). Meanwhile, constrained by data acquisition and research methods, the current research scale of AS is mainly concentrated in meso- or micro-scale such as counties, towns, villages, and farmers. The limited macro-scale AS studies mostly take the provincial administrative units as the calculation unit (Wang and Zhu, 2017), resulting in its spatial accuracy and conclusions yet to be improved. Overall, the above series of studies have played a positive role in deepening the understanding of the specialization of regional planting industry. However, AS in the current study is mostly regarded as a regional division of agricultural production activities under the existing resource conditions, while little attention has been paid to the effects of specific resource endowments on AS. In particular, the realistic dilemma of CLF and the urgent need to accelerate the development of AS further highlight the strategic significance of scientific understanding of the spatial pattern characteristics and interactions of CLF and AS in China. The solution of these issues will be of great significance to the formulation of cultivated land use policy and the cultivation of agricultural industrial clusters during China’s transformation from traditional agriculture to modern agriculture.
As such, this study firstly clarified the connotation of cultivated land landscape fragmentation at the macro-scale. Secondly, a comprehensive evaluation model of CLF was established by considering the landscape pattern characteristics of cultivated land patches in area, shape and spatial distribution. Finally, based on the data of land use and agricultural production, the spatial differentiation of CLF and AS in China and the effects of CLF on agricultural agglomeration were systematically explored on the scale of prefecture-level cities by comprehensively using the Theil index, ordinary least square model and geographically weighted regression.
2 Materials and methods
2.1 Variable measurement
2.1.1 Cultivated land fragmentation
(1) Connotation of cultivated land fragmentation (CLF)
Traditional studies on CLF have paid more attention to the fragmentation of property rights at the household/farmer scale, focusing on linking CLF with the transfer of agricultural land and rural labor based on land property rights to assess the effect of CLF on agricultural production or reveal the geographical differences of CLF (Sklenicka et al., 2014; Ciaian et al., 2018; Looga et al., 2018). With the deepening of research endeavors, CLF’s connotation and its multi-attributes in diversity, hierarchy, and scale-dependence based on the changes in social groups and cultivated land functions (Song et al., 2015) have aroused extensive attention of the international community. For example, Hartvigsen (2014) and Gonzalez et al. (2007) have proposed a multi-level assessment framework of CLF covering ownership fragmentation, resource fragmentation and utilization fragmentation. Liu et al. (2019a) and Liu et al. (2019b) have proposed the spatial-scale analysis framework of CLF including the fragmentation of land ownership and farmland utilization modes in micro-scale and the fragmentation of landscape pattern in area, shape, and spatial distribution in macro-scale, based on the differences in the spatial-hierarchy of cultivated land functions.
In summary, there is no single commonly agreed definition of CLF (Liu et al., 2019a; Ntihinyurwa et al., 2019). In the context of the call to use resources and the environment more efficiently and sustainably to promote sustainable development (Liu et al., 2019a), in addition to the traditional CLF in terms of property rights presented as a high number of farmed plots or as a high number of plot co-owners (Ciaian et al., 2018), the fragmented characteristics on the landscape pattern of cultivated land in terms of location, size distribution and shape of land plots, distances between plots, and spatial distribution have also attracted widespread attention in the academic circles (Latruffe and Piet, 2014). Therefore, unlike previous studies on CLF focusing on fragmentation of land property rights at the micro-scale, this study focuses on the landscape pattern characteristics of cultivated land for macro-scale. Referring to the previous researches (Hartvigsen, 2014; Liu et al., 2019a, 2019b), the landscape fragmentation of cultivated land at the macro-scale in this study (hereinafter referred to as CLF) is understood as: Driven by natural or human-made factors such as natural conditions, agricultural production conditions and socio-economic development, cultivated land resources in a certain region possess the comprehensive characteristics of differentiated landscape patterns in patch size, shape, and spatial agglomeration. Regional cultivated land resources generally present a landscape pattern characteristic with smaller patch size, complex and irregular shapes, and discrete and fragmented spatial distribution.
(2) Assessment of cultivated land fragmentation
Based on the above theoretical understanding, this study finally selected three indicators, namely average plot size (APS), edge density (ED), and aggregation index (AI) (Ciaian et al., 2018; Liu et al., 2019a), to characterize the landscape pattern characteristics of regional cultivated land in terms of patch size, shape, and spatial distribution. This study assumes that the smaller the APS, the higher the ED, and the lower the AI of the cultivated land resources in a certain area, so the higher the degree of CLF. On this basis, the calculation method of cultivated land fragmentation index (CLFI) is shown in formula 1.
where wAPS, wAI, and wED represent the corresponding weights of APS, AI, and ED, respectively. We consider that plot size, spatial agglomeration level and shape regularity of regional cultivated land resources are equally important for CLF, as such, wAPS=wAI=wED=1/3. Among them, the calculation process of APS, AI and ED is based on formula 2.
$APS=LA/NPED=P/LA$
where LA and NP represent the total area and number of patches of the research unit respectively; Pi represents the perimeter of the patch i; and P represents the total perimeter of cultivated land patch.
2.1.2 Agricultural specialization (AS)
(1) Specialization Index of Hirschman-Herfindahl
Referring to relevant studies (Wang and Zhu, 2017, 2018), Specialization Index of Hirschman-Herfindahl (SHHI) is used to reflect the development level of regional AS, and its calculation formula is shown in formula 3.
$SHHI=\sum\limits_{j=1}^{n}{S_{ij}^{2}}$
where Sij represents the proportion of the area of agricultural land use type j in the total area of all agricultural land in area i. n denotes the number of agricultural land use types. The value range of SHHI is between 1/n-1. The higher the value of SHHI, the higher the level of regional agricultural specialization.
(2) Classification of agricultural land use types
As the calculation of SHHI needs a complete dataset of all types of agricultural land use, we identify the planting industry according to the classification system including division, category, group, and type. This classification system reflects the gradient evolution of planting information from comprehensive to specific. Initially, 30 types of agricultural land use were considered when preparing for SHHI, specifically including rice, wheat, corn, millet, sorghum, highland barley, barley, sonja, mung bean, adzuki bean, potato, sweet potato, peanuts, rapeseeds, sesame, sunflower, cotton, jute and ambary hemp, ramee, hemp, sugarcane, beetroots, flue-cured tobacco, tea plantations, medicinal materials, vegetables, orchards, organic fertilizer, flowers, and spices. Considering the challenge of obtaining the above complete data set in reality, only the most important types of agricultural land use are usually considered in practice (Wang and Zhu, 2017; Wang and Zhu, 2018). Therefore, the above 30 types of agricultural land use were arranged in reverse order of planting area, and the cumulative proportion of the total area of the top n types of agricultural land use in the total area of all types of agricultural land use was counted. When the value of n is 13, the cumulative ratio of crop planting area to the total agricultural land area is as high as 95.39%, and the increase of n does not significantly supplement the effective information, indicating that the first 13 agricultural land use types can reflect more than 95% of China’s agricultural land use information. As such, 13 specific types of crops are determined in this paper. On this basis, the groups of 13 specific types of crops and the categories are determined according to the Industrial Classification and Codes for National Economic Activities (GB/T4754-2002) and previous studies (Liu et al., 2016; Wang and Zhu, 2017; Wang and Zhu, 2018), and the planting area data of planting groups and categories were further collected to calculate SHHI. Table 1 shows the classification of China’s planting industry.
2.2 Assessment of regional differences
This paper analyzes the regional differences of CLF and AS by Theil index (T) (Hartvigsen,
Division (1)
Category (3)
Group (10)
Type (13)
Planting industry
Grain crops, economic crops, vegetables and melon
Cereal, soybeans, tubers, oil-bearing crops, cotton, sugar crops, tobacco, tea, vegetables, melon and fruit crops
where T represents the total difference of CLF; p denotes the number of research units; Yi indicates the CLFI of unit i; uy is the average value of CLFI at national scale. The value range of T is T ∈ [0, lnp] and increases monotonically. A larger value of T suggests stronger the regional heterogeneity of the corresponding elements.
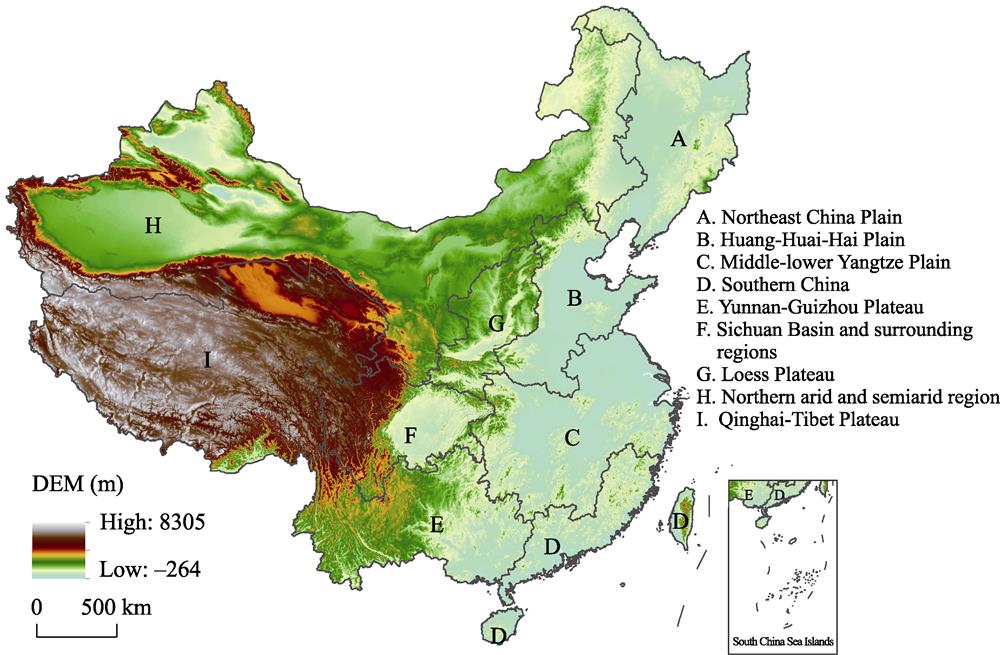
According to the regional differential laws of agricultural development in terms of production conditions, characteristics, and development directions, Resource and Environment Data Cloud Platform of Chinese Academy of Sciences has released agricultural regionalization scheme in China, which divides China into nine agricultural regions (Figure 1). Therefore, this paper analyzes the spatial characteristics of CLF and AS from the aspects of inter-regional differences of Theil index (Tinter) and intra-regional differences (Tintra) based on China’s agricultural regionalization scheme.
where m represents the number of regional groups; pi is the number of research units in region i; P represents the total number of research units; li is the average value of CLFI in region i.
2.3 Analysis model of the impact of cultivated land fragmentation on agricultural specialization
2.3.1 Ordinary least square (OLS)
OLS is used to identify the average relationship between independent and dependent variables from a global perspective (Yang et al., 2019). The regression equation is as follows:
where y is SHHI, the dependent variable; β0 is a constant; N is the number of independent variables; βn denotes the regression coefficient, and μ is a random error perturbation term subject to a normal distribution.
2.3.2 Exploratory spatial data analysis
Moran's I index and Getis-ord general G index (Anselin, 1995; Getis and Ord, 1992) are used to determine whether there was spatial agglomeration of CLF and its landscape pattern characteristics, i.e., APS, ED, and AI. Taking the CLFI as an example, the calculation method is as follows.
where Wij is a spatial weight matrix; n is the number of samples; CLFIi represents the CLF of the i-th research unit; represents the average value of CLFI; S represents the variance between CLFIi and $\bar{CLFI}$.
Moran's I $\in$ [-1, 1]. At a given level of significance, if Moran's I > 0, it means that regions with higher (or lower) CLF have a significant spatial agglomeration; otherwise, there is a significant spatial difference between the region and its surrounding areas. If Moran's I is close to 0, it indicates that CLF is random and the spatial correlation is weak.
Under the condition of normal distribution, the test statistic of G(d) is Z(G) =[G-E(G)/$\sqrt{Var(G)}$] , where Var(G) is the coefficient of variation. When G(d) > E(G), and the Z value is significant, this indicates that there is a spatial clustering of high-value clusters; otherwise, there is a phenomenon of spatial clustering of low-value clusters.
2.3.3 Geographically weighted regression (GWR)
In the case of spatial aggregation of independent variables, GWR is further used to estimate the local parameters to explore the spatial variation of the impact of CLF on AS. The structure of GWR is as follows (Yang et al., 2019):
where yi and xim are dependent variable and independent variable respectively; (ui, vi) is the geographic coordinates of the i-th sample; βm(ui, vi) is the value of continuous function βm(u, v) in the i-th sample; β0(ui, vi) is the intercept of regression equation; q is the number of independent variables; and εi is the random error.
3 Results and analysis
3.1 Spatial differentiation characteristics of cultivated land fragmentation in China
On the whole, Heihe-Tengchong Line, also known as Hu Huanyong Line, has shaped the spatial heterogeneity of China’s CLF, showing a gradual increase from northwest to southeast, with obvious regional differences (Figure 2). Spatially, CLF in the eastern region is significantly higher than that in the western region, while that in the southern region is significantly higher than that in the northern region (Figure 2d).
The contribution of inter-regional and intra-regional differences of CLF to the total difference at the national scale is both 50%, indicating that the endowments of cultivated land in China vary greatly, and the issues of CLF are complex and diverse. In terms of fractal dimensions of CLF, the Theil index of APS, ED, and AI were 0.332, 0.121, and 0.174, respectively, and the corresponding inter-regional differences contributed 57.83%, 54.55%, and 32.76% to the total difference, respectively. The above results indicate that the spatial difference of the patch size of cultivated land in China is the largest, followed by the spatial agglomeration level, and the patch segmentation is the smallest. Meanwhile, the spatial differences in patch size and patch segmentation of cultivated land mainly occurred among agricultural divisions, while the spatial agglomeration level of patches mainly occurred within agricultural divisions.
Figure 2.
Spatial differentiation of cultivated land fragmentation in China
According to the spatial differences of CLF in different agricultural subregions (Figure 3a), the order of CLFI from high to low is as follows: Southern China (SH) > Sichuan Basin and surrounding regions (SBSR) > Middle-lower Yangtze Plain (MLYP) > Loess Plateau (LP) > Yunnan-Guizhou Plateau (YGP) > Huang-Huai-Hai Plain (HHHP) > Northeast China Plain (NCP) > Qinghai-Tibet Plateau (QTP) > Northern arid and semiarid region (NASR). In terms of spatial difference structure of CLF in each agricultural subregion (Figure 3b), the order of Theil index of CLF is: NCP > NASR > QTP > SH = MLYP = HHHP > YGP > SBSR = LP, and the contribution of intra-regional differences of CLF in each agricultural subregion to the total difference was greater than 50%. The above quantitative results showed that the intra-regional differences of CLF are the main factors causing the significant differentiation of CLF within subregions. Although the endowment of cultivated land resource in the Northeast China Plain and the Northern arid and semiarid region characterized by a low degree of CLF is generally superior, but the spatial unbalance of the endowment of cultivated land within the region is serious. On the contrary, the cultivated land resources in Southern China and Middle-lower Yangtze Plain are relatively homogeneous, but the degree of CLF with small spatial differences is serious.
Figure 3.
The difference of cultivated land fragmentation in various agricultural regions of China
3.2 Geographical agglomeration of agricultural specialization in China
In general, China’s AS with significant spatial differences has spatially formed three high-value clusters in the Northeast China Plain, the Qinghai-Tibet Plateau, and the middle of the Middle-lower Yangtze Plain; and the low-value contiguous areas centered on the Yunnan-Guizhou Plateau and the Sichuan Basin and surrounding regions (Figure 4a). The average value of SHHI of grain crops, economic crops, and vegetables and melon are 0.203, 0.023, 0.039, respectively, which contributed 74.63%, 9.09%, and 16.28% to the specialization level of China’s planting industry. The Theil index presents the opposite pattern to SHHI, and expresses as economic crops > vegetables and melon > grain crops. The intra-regional differences of the three categories of crop are both the main factors constituting the total differences, accounting for 79.18%, 54.13%, and 64.40% respectively. The cumulative contribution rate of cereals, vegetables, melon and fruit crops, tubers, and oil-bearing crops to the level of AS is as high as 91.77%, and they are the key crop groups that affected the geographical agglomeration of China’s AS, and the proportion of intra-regional differences in each group to the total difference is both greater than 54.63%. In particular, the contribution of cereals alone to the development level of AS is as high as 65.90%, indicating that China’s agricultural geographic agglomeration dominated by grain crops (cereals) is taking shape. The above results indicate to a certain extent that grain crops have the highest level of specialization and the smallest spatial difference, while the specialization level of economic crops is the lowest and the spatial difference is the largest.
Specifically, the specialized production of grain crops is concentrated in the Northeast China Plain, the Huang-Huai-Hai Plain, the south-central part of the Middle-lower Yangtze Plain, and the Qinghai-Tibet Plateau (Figure 4b). The contribution of cereal, soybeans, and tubers to the specialization of grain crops is 88.45%, 4.27%, and 7.28% (Figures 4b1-b3), respectively, indicating that cereals play a critical role in shaping the geographical agglomeration of China’s grain production, and the continuous agglomeration belt of specialized cereal production along the northeast-southwest direction of the Northeast China Plain - Huang-Huai-Hai Plain - Middle-lower Yangtze Plain and the cluster of the Qinghai-Tibet Plateau have been formed in space. In contrast, soybeans production is concentrated in Heilongjiang Province in the Northeast China Plain (Figure 4b2), while tubers have formed a north-south spatial pattern along the central part of the Northern arid and semiarid region - Sichuan Basin and surrounding regions - central and northern parts of Yunnan-Guizhou Plateau (Figure 4b3).
The specialization level of economic crops has spatially formed geographical clusters focusing on the western Northern arid and semiarid region, the northeast of the Qinghai-Tibet Plateau, the western and eastern Yunnan-Guizhou Plateau, and the Middle-lower Yangtze Plain (Figure 4c). Oil-bearing crops, cotton, sugar crops, tobacco, and tea contributed 66.33%, 11.41%, 5.18%, 5.32%, and 6.50% to the specialization level of China’s economic crops (Figures 4c1-c5), respectively, indicating that oil-bearing crops and cotton are the main crop groups affecting the geographical agglomeration of economic crops. Among them, oil-bearing crops are mainly concentrated in the central and northern parts of the Middle-lower Yangtze Plain, the northeast of the Qinghai-Tibet Plateau, the central and northeastern parts of Yunnan-Guizhou Plateau, and the Sichuan Basin and surrounding regions (Figure 4c1). Cotton is mainly distributed in Xinjiang Province in the western Northern arid and semiarid region and the borders of Tianjin, Hebei, and Shandong in Huang-Huai-Hai Plain (Figure 4c2).
The contribution of vegetables, and melon and fruit crops to the specialization of vegetables and melon in China is 72.44% and 27.56% respectively, and three significant clusters were formed spatially (Figures 4d and 4d1-d2), namely, the cluster of melon and fruit crops in the west northern arid and semiarid region, the mixed production cluster of vegetables and melon and fruit crops in the central-eastern Sichuan Basin and Yunnan-Guizhou Plateau, and the mixed production cluster in eastern coastal zones dominated by the east side of Wuyi Mountain.
3.3 The impact of cultivated land fragmentation in China on agricultural specialization
3.3.1 Comprehensive analysis of whole samples based on OLS
Table 2 shows the simulation results of OLS based on whole samples. The whole samples analysis shows that CLF was negatively correlated with SHHI at a significant 1% level,indicating that the specialization level of planting industry decreased with the increase of farmland fragmentation. In general, every 1% increase in CLF will lead to a decrease of 0.2% in the development level of SHHI. In terms of the impact of CLF on the specialization of different categories of planting industry, CLF has a significant negative correlation with the specialization level of grain crops, but a significant positive correlation with the SHHI of vegetables and melon, and the effect intension of CLF is that grain crops are greater than vegetables and melon. For example, every 1% increase in the degree of CLF will reduce the specialization level of grain crops by about 0.38%, and increase the specialization of vegetables and melon by 0.22%. In contrast, CLF has no significant impact on the specialization level of economic crops. In terms of the impact of landscape pattern of cultivated land on AS, ED of patches has a significant inhibitory effect on the specialized production of grain crops, especially for cereals and soybeans, indicating that the increased spatial division of plots and the complexity and irregularity of shapes will lead to the decline of specialized production level of grain crops, such as cereals and soybeans. In addition, the specialization level of soybeans is also positively affected by the agglomeration of cultivated land. In contrast, ED and AI have opposite effects on the specialized production level of vegetables and melon. On the whole, every 1% increase of ED will increase the specialization level of vegetables and melon by 0.14%, while every 1% increase in AI will reduce by about 0.17%.
Figure 4.
Spatial differentiation characteristics of agricultural specialization in China
3.3.2 Spatial heterogeneity analysis based on geographically weighted regression
(1) Construction of geographically weighted regression and simulation results
The Moran's I index of CLFI is 0.657, and its G index value is positive. In addition, the Moran's I index and G index of the three fractal indicators (i.e., APS, ED, and AI) of integrated CLFI are all positive, indicating that there is an obvious spatial agglomeration pattern of CLFI and its landscape characteristics. It is suggested that GWR should be used to further detect the spatial differences of the influence of independent variables on dependent variables, owing to the significant spatial agglomeration among independent variables.
Therefore, GWR was used to carry out the spatial heterogeneity analysis between the planting industry categories passing the significant test at the 1% level in Table 2 and the CLF and its landscape characteristics, and the results were shown in Table 3. Compared with the estimated results of OLS, the average goodness-of-fit of GWR is 0.4367, which is 33.54% higher than that of OLS, indicating that the simulation results of GWR are significantly better than those of OLS.
Dependent variable
Cultivated land fragmentation
Landscape characteristics of cultivated land
Bandwidth
Sigma
AICc
R2
Bandwidth
Sigma
AICc
R2
SHHI
5.223
0.09
-624.568
0.426
6.598
0.09
-639.02
0.473
SHHI of grain crops
5.223
0.10
-554.977
0.470
6.598
0.10
-551.917
0.486
Cereals
5.223
0.10
-539.595
0.424
6.598
0.10
-525.532
0.423
Soybeans
5.223
0.05
-1004.853
0.416
6.598
0.05
-970.156
0.378
SHHI of vegetables and melon
5.223
0.05
-993.151
0.432
6.598
0.05
-1009.978
0.482
Vegetables
5.223
0.04
-1163.867
0.375
6.598
0.04
-1195.699
0.455
Table 3.
Regression results of geographically weighted regression
(2) Spatial heterogeneity of the impact of cultivated land fragmentation on agricultural specialization
Based on the results of OLS and GWR, the following focuses on the spatial heterogeneity of CLF’s impact on the specialization level of the planting industry, the grain crops (i.e., cereals, soybeans), the vegetables and melon (vegetables), as well as the spatial differences of the effects of landscape characteristics of cultivated land such as ED and AI on the specialization of the above-mentioned planting industry categories (Figures 5 and 6).
The spatial impact of CLF on SHHI formed a negative low-value clusters in the southern part of Northeast China Plain and the Qinghai-Tibet Plateau, and a positive high-value clusters formed in the central and western parts of Northern arid and semiarid region and the borders of Yunnan-Guizhou Plateau and Southern China (Figure 5a). Among all the landscape characteristics of farmland considered in this study, the AI of patches has the most prominent impact on SHHI of planting industry. Besides the southwest of Yunnan-Guizhou Plateau, the effect intension of AI presents a spatial pattern that gradually increases from the eastern coastal zone to northwest inland (Figure 6a). In general, AI of patches had negative inhibitory effect on planting specialization in the central and western regions, and the effect intensity is significantly higher than that in the eastern coastal zones.
CLF is mainly negatively correlated with SHHI of grain crops, and the spatial pattern of CLF’s impact on grain crops specialization is basically consistent with that of CLF on cereals (Figures 5b and b1). Patches’ ED has a prominent negative inhibitory effect on the specialization of grain crops. In addition to the western part of the Qinghai-Tibet Plateau, the spatial patterns of the positive high-value agglomeration areas and negative low-value agglomeration areas affected by ED on grain crops specialization are basically consistent with the spatial patterns of the impact of CLF on it (Figures 6e and 6g). The above results show that the weakening of CLF characterized by the decrease of spatial division of patches, will significantly promote the specialized development and geographical agglomeration of grain crops, especially cereals, in the southeast coastal zones, the south of Northeast China Plain, the central and western parts of Northern arid and semiarid region, and the Qinghai-Tibet Plateau. In contrast, CLF had a negative inhibitory effect on soybeans specialization, and its influence formed two significant spatial differentiation areas, namely, the positive high-value clusters in the north of Northeast China Plain (i.e., the northern Heilongjiang Province), and the negative low-value clusters in the central and eastern parts of the Qinghai-Tibet Plateau, and the effect intension of CLF was significantly higher in the Qinghai-Tibet Plateau than in the Northeast China Plain (Figure 5b2). In terms of landscape pattern, both ED and AI play key roles with obvious spatial differentiation in the geographical agglomeration of soybeans specialization (Figures 6c and 6h), which is negatively inhibited by the former and positively promoted by the latter.
There is a positive correlation between CLF and the SHHI of vegetables and melon. The effect intension of CLF on vegetables and melon specialization shows a decreasing trend from the southeast coastal zones to northwest inland, and a positive high-value agglomeration area is formed in the junction of the Middle-lower Yangtze Plain, the Southern China, and the Yunnan-Guizhou Plateau (Figure 5c). The above spatial pattern is basically consistent with the pattern of CLF’s impact on vegetables specialization. The difference is that the low-value impact area of CLF on vegetables specialization further extends to the northwest inland, and spatially forms positive low-value clusters in Northeast China Plain, Loess Plateau, the northeastern and western parts of the Qinghai-Tibet Plateau, and central part of Northern arid and semiarid region (Figure 5c1). Both AI and ED have a prominent impact on the specialization of vegetables and melon, especially on the specialization of vegetables, and the impact intensity of both presents a spatial pattern that gradually decreases from the southeast coast to the northwest inland (Figures 6b, 6d, 6f and 6i). In conclusion, CLF enhancement, mainly characterized by the weakening of spatial agglomeration and enhancement of spatial segmentation of patches, has limited promotion on the specialization of vegetables and melon in the Northeast China Plain and the northwest inland areas, but can significantly drive the specialized production and geographical aggregation of vegetables and melon in the southeast coastal zones.
Figure 5.
Distribution of regression coefficients of the impact of cultivated land fragmentation on planting specialization in China
Restricted by basic data, index quantification and research methods, present studies on CLF and its impact primarily focus on meso- or micro-scale, such as counties, towns and villages, and farmers. As far as we know, this study is the first attempt to provide new ideas for the formulation of cultivated land use policies and the cultivation of agricultural industrial clusters in the new era by comprehensively measuring the status of CLF at the national scale and the spatial pattern of planting specialization. However, there are some uncertainties in the estimation results of CLF and planting specialization due to the lack of timeliness of basic data. The cultivated land use data in this paper is from the second national land survey database (2011). On this basis, we further collected the crop planting area data of each research unit in 2011 from the corresponding provincial and municipal statistical yearbooks and rural statistical yearbooks in 2012 to match the collection period of cultivated land use data. Although the land survey results with a spatial resolution of 1:10000 to a certain extent ensure the accuracy and authenticity of the measurement results of CLF during the study period, objectively, there are some deficiencies in the timeliness of data, which makes the evaluation results of CLF lag behind the current farmland utilization information to some extent. Similarly, the timeliness of the crop planting area data may also lead to the uncertainty and lag of the estimation results of the planting industry specialization to a certain extent.
4.2 Comparison with related studies
This study collected relevant studies on CLF and AS to compare with this study to test the time-effectiveness of basic data.
As for the previous studies on CLF, Zhang (2017) quantitatively assessed the spatial differentiation characteristics of CLF in China based on the sampling survey data in 2014, and found that the comprehensive CLFI gradually decreased from the southeast coast to the northwest inland, which was consistent with the spatial differentiation presented in this study. Liu et al. (2019a) clarified the regional distribution pattern of CLF in Jiangsu Province based on the survey data of land use change in 2014, which gradually increased from north to south, and also maintained good consistency with the results of this study. In terms of AS research, Wang et al. (2017) quantitatively measured the average level of agricultural land use specialization in China from 2010 to 2012 based on statistical survey data, and found that the agricultural land use specialization level in northeast three provinces, Jiangxi and Hunan was higher, while that in Southwest China was lower. The results of our study are in good agreement with the results of Wang et al. (2017) in terms of regional differentiation pattern and key areas of planting specialization.
On the whole, although the basic data used in this paper has certain shortcomings in terms of timeliness, comparison with related researches shows that a certain degree of reliability and rationality exists in this study in characterizing the geographical differentiation pattern of CLF and AS. It can provide basic information for the implementation of differentiated farmland resource utilization and management policies based on the specialized development of specific crop types.
4.3 Policy implications for the utilization and management of cultivated land in China
4.3.1 Policy enlightenments of CLF spatial pattern to regional land use
The results show that CLF with small spatial differences in Southern China and Middle-lower Yangtze Plain is more serious, characterized by the smaller average plot size and higher spatial segmentation. Many studies (Li and Qi, 2019; Liu et al., 2019a) have shown that high-intensity human activities and rapid urbanization in the above-mentioned areas have an important driving role in farmland landscape fragmentation, which means that in the future, it is necessary to further strictly control land uses and strengthen cultivated land protection to intervene the evolution trend of farmland fragmentation. Therefore, on the one hand, it is necessary to determine a reasonable urban growth boundary to control the scale of construction land; on the other hand, it is also necessary to further improve the basic land supply mechanism, planning and decision-making mechanism, and strictly control the space occupation of agricultural land by urban non-agricultural construction.
4.3.2 Differential farmland management policies based on AS characteristics
Land consolidation has been considered as a key measure to tackle the CLF problem and promote agricultural modernization in many countries across the world (Liu et al., 2019a; Liu et al., 2019b). The differences in the impact of CLF on the geographical agglomeration of different categories or groups of planting industry indicate that the promotion of AS development requires the implementation of differentiated cultivated land management policies and land consolidation policies based on regional specialization characteristics. For example, in view of the difference of the ED and AI of land patches on the geographical agglomeration of various categories or groups of planting industry (Section 3.3.1), the focus of land consolidation in traditional agricultural areas (such as Heilongjiang, Shandong, and Henan, etc.) shouldering the responsibility of ensuring national food security should be to reduce the discrete distribution and spatial division of cultivated land through engineering techniques to further strengthen the specialized production pattern of grain crops. The practice of land consolidation can rely on the combination of high-standard farmland construction with rural construction land consolidation to form high-standard farmland with large scale, regular shapes, centralized and contiguous distribution, and supporting irrigation and drainage facilities (Liu et al., 2019a). For some areas with obvious advantages in the specialization of vegetables and melon, such as Zhejiang Province, Fujian Province, and some prefecture-level cities in Guangdong Province, land consolidation should avoid the stereotyped construction of high-standard farmland, and appropriately retain a certain degree of farmland fragmentation in combination with the characteristics of the regional resources and environment. Meanwhile, land consolidation in these areas should also pay more attention to the construction and improvement of regional agricultural infrastructure, such as roads and ditches, to provide effective support for the cultivation and construction of geographic clusters of vegetables and melon.
5 Conclusions
(1) Heihe-Tengchong Line has shaped the spatial differentiation pattern of China’s CLF gradually increasing from northwest to southeast coastal zones. At the national scale, the spatial differences of fractal dimensions of CLF presented the variation of APS>AI>ED, indicating that the spatial difference of the patch size of cultivated land in China is the largest, while the spatial difference of patch segmentation was the smallest. On the regional scale, CLFI in Northeast China Plain and Northern arid and semiarid region is both lower with a higher Theil index, while Southern China and Middle-lower Yangtze Plain both have a higher CLFI but a lower Theil index. The above results indicate that the degree of CLF in Northeast China Plain and Northern arid and semiarid region is relatively weak with vast regional differences, while the cultivated land resources in Southern China and Middle-lower Yangtze Plain are relatively homogeneous, but the degree of fragmentation is serious.
(2) The average value of SHHI in China is 0.264. Among them, the SHHI of grain crops, economic crops, and vegetables and melon has contributed 74.63%, 9.09%, and 16.28% to the SHHI of China’s planting industry, respectively. The Theil Index presents the order of economic crops > vegetables and melon > grain crops. The above results indicate that the specialization level of grain crops is the highest and the spatial difference is the smallest, while the specialization level of economic crops is the lowest and the spatial difference is the largest. Meanwhile, an agricultural geographical agglomeration pattern dominated by grain crops (cereals) has been initially formed.
(3) In general, there is a certain spatial trade-off effect between CLF and SHHI in China. Every 1% increase in CLF will reduce the level of SHHI by about 0.2%, but the impact on different crop categories or groups is significantly different. CLF has a significant impact on the specialized development of grain crops and vegetables and melon, but has a relatively weak impact on the specialization of economic crops. The ED and AI of land patches are the key landscape features that affect the geographic agglomeration of planting industry, and their intensity of influence and direction show significant regional differences, while the average plot size has no significant impact. The enhancement of CLF, characterized by the reduction of spatial agglomeration and the increase of spatial segmentation of land patches, will inhibit the specialization and geographical agglomeration of grain crops such as cereal and soybeans to a certain extent, and promote the specialized production of vegetables and melon, especially vegetables.
References
[1] AnselinL. Local indicators of spatial association: LISA. Geographical Analysis, 27, 93-115(1995).
[2] Chen TZ, Li EL, LiW. Geographical agglomeration of crops and its evolutionary mechanism in Henan Province during 1989-2009. Progress in Geography, 32, 1237-1245(2013).
[3] CiaianP, GuriF, RajcaniovaM et al. Land fragmentation and production diversification: A case study from rural Albania. Land Use Policy, 76, 589-599(2018).
[4] de RoestK, FerrariP, KnickelK. Specialisation and economies of scale or diversification and economies of scope? Assessing different agricultural development pathways. Journal of Rural Studies, 59, 222-231(2018).
[5] GetisA, Ord JK. The analysis of spatial association by the use of distance statistic. Geographical Analysis, 24, 189-206(1992).
[6] GonzalezX, MareyM, AlvarezC. Evaluation of productive rural land patterns with joint regard to the size, shape and dispersion of plots. Agricultural Systems, 92, 52-62(2007).
[7] HartvigsenM. Land reform and land fragmentation in Central and Eastern Europe. Land Use Policy, 36, 330-341(2014).
[8] KlasenS, Meyer KM, DislichC et al. Economic and ecological trade-offs of agricultural specialization at different spatial scales. Ecological Economics,, 122, 111-120(2016).
[9] KrugmanP. Increasing returns and economic geography. Journal of Political Economy, 99, 483-499(1991).
[10] LatruffeL, PietL. Does land fragmentation affect farm performance? A case study from Brittany, France. Agricultural Systems, 129, 68-80(2014).
[11] Li GD, QiW. Impacts of construction land expansion on landscape pattern evolution in China. Acta Geographica Sinica, 74, 2572-2591(2019).
[12] LiuJ, Jin XB, Xu WY et al. Influential factors and classification of cultivated land fragmentation, and implications for future land consolidation: A case study of Jiangsu Province in eastern China. Land Use Policy, 88, 104185(2019).
[13] LiuJ, Jin XB, Xu WY et al. Evaluation of cultivated land fragmentation and guidance of land consolidation at provincial level. Scientia Geographica Sinica, 39, 817-826(2019).
[14] Liu ZH, YangP, Wu WB et al. Spatio-temporal changes in Chinese crop patterns over the past three decades. Acta Geographica Sinica, 71, 840-851(2016).
[15] LoogaJ, JürgensonE, SikkK et al. Land fragmentation and other determinants of agricultural farm productivity: The case of Estonia. Land Use Policy, 79, 285-292(2018).
[16] MintenB, Murshid KA, ReardonT. Food quality changes and implications: Evidence from the rice value chain of Bangladesh. World Development, 42, 100-113(2013).
[17] Ntihinyurwa PD, de Vries WT, Chigbu UE et al. The positive impacts of farm land fragmentation in Rwanda. Land Use Policy, 81, 565-581(2019).
[18] Porter ME. Clusters and the new economics of competition. Harvard Business Review, 76, 77(1998).
[19] Schultz TW. The declining economic importance of agricultural land. The Economic Journal, 61, 725-740(1951).
[21] SklenickaP, JanovskaV, SalekM et al. The Farmland rental paradox: Extreme land ownership fragmentation as a new form of land degradation. Land Use Policy, 38, 587-593(2014).
[22] Song XQ, HuangY, Wu ZF et al. Does cultivated land function transition occur in China?. Journal of Geographical Sciences, 25, 817-835(2015).
[23] Wang WH, Zhu HY. Household farmland area and regional specialization: An empirical analysis at provincial level. Acta Geographica Sinica, 72, 269-278(2017).
[24] Wang WH, Zhu HY. Main limiting factor of the regional specialization of agricultural land use in China. Journal of Natural Resources, 33, 361-371(2018).
[25] Wu NL, Qiao JJ, Li XJ. The spatial diffusion of agricultural specialized production under government promotion: A case study of mushroom production in Xixia county. Geographical Research, 36, 1557-1569(2017).
[26] YangL, Liu MC, Min QW et al. Specialization or diversification? The situation and transition of households’ livelihood in agricultural heritage systems. International Journal of Agricultural Sustainability, 16, 455-471(2018).
[27] Yang QQ, LiuQ, YinS et al. Vulnerability and influencing factors of rural transportation environment in Qinling-Daba mountainous areas: A case study of Luonan county in Shaanxi province. Acta Geographica Sinica, 74, 1236-1251(2019).
[28] Zhou YH, LvC, ZhouD. Analysis of the influencing factors of the formation of main vegetable production areas in China: A case study of Shouguang in Shandong Province. Geographical Research, 31, 687-700(2012).
Weiyi XU, Xiaobin JIN, Jing LIU, Yinkang ZHOU. Impact of cultivated land fragmentation on spatial heterogeneity of agricultural agglomeration in China[J]. Journal of Geographical Sciences, 2020, 30(10): 1571