
Guodong LI, Junhua ZHANG, Parham A. MIRZAEI, Shengyan DING, Yapeng DING, Man LIU. Monitoring thermal field, humidity field and energy balance over heterogeneous surfaces in the typical valley-city[J]. Journal of Geographical Sciences, 2020, 30(12): 2015
- Journal of Geographical Sciences
- Vol. 30, Issue 12, 2015 (2020)
Abstract
1 Introduction
Rapid urbanization dramatically changes the regional LULC, exerting its effects on the local weather, atmospheric boundary layer structure, local circulation (
At present, the effects of urban LULC change on global climate change have become a focus in the scientific community (
Most of current research is focused on the remote sensing inversion of either brightness temperature or LST (
Given the above considerations, the aim of this research is to combine both mobile and fixed-point measurements, geo-statistical methods, GIS spatial analysis, and the quantitative remote sensing to obtain the structure characteristics of the urban temperature and humidity fields with high spatio-temporal resolution. Moreover, this study intends to depict the complex physical process through which LULC alteration drove the evolution of the temperature and humidity fields and climate effects in the near-surface heterogeneous layer of the urban areas. Lanzhou city, the most typical river valley city of China, was identified as a study case, for its typical river valley terrain, rapid urbanization and severe air pollution have caused unique urban climate and UHI effects. The study could provide theoretical support for air pollution prevention, urban planning, land use and urban eco-environment construction of valley cities.
2 Study area
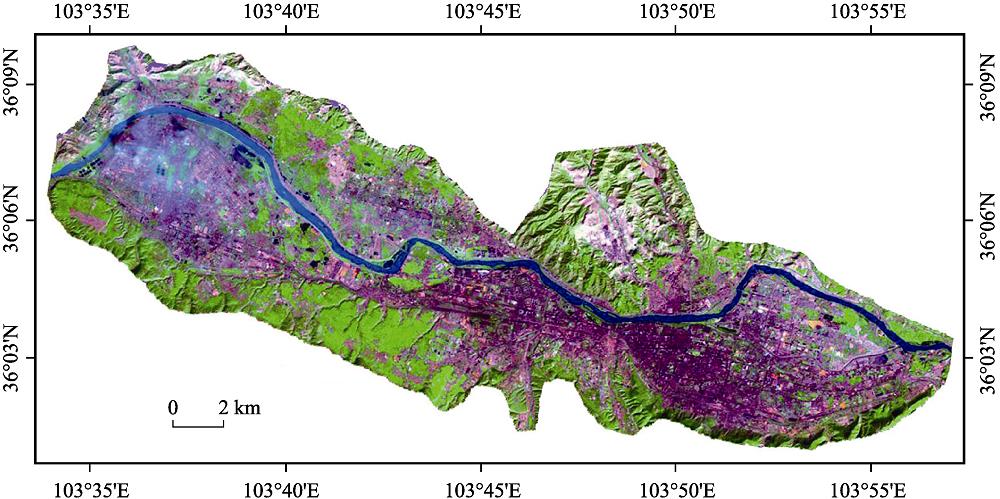
The city of Lanzhou is situated in the contiguous zone of the Loess Plateau, Tibetan Plateau and Inner Mongolia Plateau (
![]()
Figure 1.
![]()
Figure 2.
![]()
Figure 3.
As a river valley city, Lanzhou has experienced restrictions of natural conditions, and gradually developed into the one with multi-functional divisions and multi-center groups, which deeply influence the urban temperature and humidity fields, and urban climate characteristics are different from other cities located in plains. Besides, air pollution in valley cities are universal across the world, while the diffusion of atmospheric pollutants has a close relationship with heat island circulation and land-atmospheric energy exchange process (
3 Data and methods
3.1 Measurement experiments
3.1.1 Mobile and fixed-point measurement experiments
Mobile and fixed-point measurements of multiple meteorological elements were conducted in typical urban area of Lanzhou using vehicles during Jan. 1999, Apr. 1999, Oct. 1999, Jul. 2000, Jul. 2006, Oct. 2006, Jan. 2007, Apr. 2007, Jul. 2016, Oct. 2016, Dec. 2016, and May 2017. Measurement experiments were conducted under clear and calm weather conditions.
![]()
Figure 4.
3.1.2 Comparative observation experiments of land-atmosphere heat fluxes and energy balance between urban and rural areas
Two Bowen-ratio Systems (SL5, Australia) were respectively installed in the Panxuan Road Campus of Lanzhou University in city center and the Yuzhong Campus of Lanzhou University in rural area (see
![]()
Figure 5.
3.2 Remote sensing retrieval of urban LULC and NDVI
In order to analyze the relationship between urban LULC, vegetation type with temperature and humidity fields, the LULC and NDVI are extracted from remote sensing images, Landsat-5 TM images that cover the whole study area were purchased from China Satellite Ground Station of Chinese Academy of Sciences. The date of images is September 18, 2007, which is close to the date of mobile observation experiments. The cloud cover of the upper left area of the images was 1% while it was zero for the rest of three districts. LULC of Lanzhou is classified according to the LULC classification procedures. The ISODATA algorithm of unsupervised classification method is used to carry on iteration clustering based on ENVI 5.3 software, combined with the current land-use map to confirm each classification attribute. LULC of Lanzhou is divided into 7 types in this study. NDVI is one of the best indicators to identify the type, growth status, and spatial distribution density of vegetation. Its value depends on the vegetation coverage and leaf area index. NDVI of Lanzhou is extracted through the geometric correction, radiometric calibration, atmospheric correction, and NDVI calculation procedures under ENVI 5.3 software environment.
3.3 Datasets
The daily meteorological data of Lanzhou central meteorological station in city center and Yuzhong County meteorological station in rural area during 1958-2019 were collected from Gansu Provincial Meteorological Bureau and China Meteorological Data Service Center (CMDC). The urbanization data and socioeconomic statistical data came from Lanzhou Statistical Yearbooks during past 70 years.
3.4 Data process methods
3.4.1 Time difference correction of mobile observation data
First, the fixed-point measurement data was used to correct the mobile measurement data at different time periods. Using the fixed-point measurement data taken every 5 minutes, the trend equation of measured values at every period was fitted by the least square method. Then, according to the trend equation, the relation between time and measured value of fixed-point measurement was used to correct the measured value of every measurement point of mobile measurement.
3.4.2 Spatial database and spatial interpolation
The spatial interpolation procedures are as follows: First, based on the corrected air temperature, relative humidity, and spatial location information at all mobile measurement points, the GIS spatial database was established using ArcGIS10.3 software. Second, the Geo-statistical module was used to perform a test on the spatial data so as to identify and adjust the distribution, outlier values, and overall trend of data. Third, a suitable interpolation was modeled to generate surface prediction. In this study, through statistical analysis and cross validation of the spatial data, the Inverse Distance Weight (IDW) method was selected to establish thermal and humidity fields. Finally, verifying the spatial interpolation results by cross validation method.
(1) Inverse Distance Weight
The IDW method takes the distance between interpolation point and sample point as the weight, so the weight contribution is inversely proportional to the distance. IDW has good effect in local variation simulation. It is defined as follows:
where
(2) Cross validation
Cross validation method is used to verify the spatial interpolation results. The method assumed that the value of every observation point is unknown, it can be estimated by the observed values of the surrounding observation points. According to the error size between observed values and estimated values of all observation sites to judge whether the interpolation effect is good or bad. Mean Error (ME) and Root Mean Squared Error (RMSE) are selected as the evaluation criteria to estimate the error size of the spatial interpolation, which are demonstrated by the following equations:
where
3.4.3 Data process of Bowen-ratio System experiments
The observed elements of the Bowen-ratio System include the dry-bulb and wet-bulb temperatures at the height of 0.5 m and 1.5 m, net radiation, soil heat flux, and wind speed. Using the above observational elements, other meteorological elements can be thus calculated, including vapor pressure, relative humidity, dew point temperature, saturation vapor pressure, saturation deficit and specific humidity at the height of 0.5 m and 1.5 m. According to the gradient diffusion theory, the sensible heat flux, latent heat flux and Bowen ratio values over urban underlying surfaces can be calculated with the following equations:
where
4 Results and analysis
4.1 Dynamic characteristics of thermal and humidity fields in autumn
4.1.1 Dynamic characteristics of thermal field
The spatial pattern of the thermal field at 8:30 on October 29, 2006 is demonstrated in
![]()
Figure 6.
The spatial pattern of the ground thermal field at 14:30 on October 29, 2006 is demonstrated in
As illustrated in
4.1.2 Dynamic characteristics of humidity field
The spatial patterns of humidity field at different periods on October 29, 2006 are demonstrated in
![]()
Figure 7.
In general, the mean relative humidity of the whole area at 8:30, 14:30 and 20:30 are 47.2%, 26.3% and 28.8%, respectively. The humidity field is strong in the morning, and it is consistent with the typical change of the relative humidity within a day, which depends on the temperature change. With the temperature rising, the evaporation and vapor pressure are also increasing. But the saturated vapor pressure increases more than vapor pressure, so the relative humidity is decreasing. When the temperature is decreasing, the result is opposite. Considering of spatial pattern of the humidity field, there are huge overlaps between the high humidity areas and vegetation coverage areas, like Gaotan, Wuquan Park are all high humidity value areas.
The humidity value of the city center is low in general such as the surrounding area of Donggang Road, which is very obvious around the second thermal power plant. For the densely populated areas, business districts and concentrated buildings area, according to the previous analysis of the thermal field intensity, their temperature is generally higher. Thus, the saturation vapor pressure of these areas is totally at a high level, which eventually forces the relative humidity to a low level. Therefore, the high or low relative humidity value is bound up with the thermal field intensity. Besides, due to the influence of the Yellow River, the relative humidity of the nearby areas is generally at a high level.
4.1.3 Simulation accuracy verification of temperature and humidity fields
Cross validation method is used to verify the spatial interpolation results of temperature and humidity fields. The results of the cross validation are presented in
| Temperature | Temperature | Temperature | Relative humidity at 8:30 (%) | Relative humidity at 14:30 (%) | Relative humidity at 20:30 (%) | |
|---|---|---|---|---|---|---|
| Mean Error (ME) | 0.07 | 0.04 | -0.02 | -0.03 | -0.13 | -0.10 |
| Root Mean Squared Error (RMSE) | 0.70 | 0.94 | 0.88 | 1.98 | 1.03 | 1.25 |
Table 1.
Results of the cross validation
4.2 Spatial patterns of LULC and green space
In order to analyze the relation between the LULC, vegetation type with the temperature and humidity fields, the LULC and NDVI are extracted from remote sensing images. Landsat-5 TM images cover the whole study regions, it is close to the date of mobile measurement experiments. LULC of Lanzhou is classified according to the land use status classification procedures. The national land-use classification system has two levels: level one has 8 types, and level two has 46 types. The ISODATA algorithm of unsupervised classification method is used to carry on iteration clustering, it then combined with the present land-use map to confirm each classification attribute. LULC of Lanzhou is divided into 7 types in this study, they are urban construction land, water area, forest land, grassland, agricultural land, industrial land and other types as shown in
![]()
Figure 8.
There is a close relationship between the structural characteristics of the temperature and humidity fields and the spatial distribution of urban impervious surfaces. The distributions of the thermal and humidity fields in Lanzhou have multiple centers and intensity level characteristics. The thermal centers are mainly distributed in the high density regions in terms of population and buildings, in the regions with high emission of anthropogenic heats, in the heavy traffic zones, and in the industrial districts. On the contrary, there are obvious high-value areas in the humidity field and low-value areas in the thermal field located in watery areas, vegetated regions, and the places with a low intensity of human activities.
NDVI is one of the best indicators to identify the growth status and spatial distribution density of vegetation (
![]()
Figure 9.
The value range of NDVI is between -1 and 1, a higher value indicates a more green vegetation. A pixel is totally covered by the bare soil or building when NDVI<0.2, by the vegetation when NDVI>0.5, and by a combination of the bare surface and vegetation when 0.2≤NDVI≤0.5 (
4.3 Heat fluxes and energy balance between underlying surface and atmosphere
Urban morphology is complex and heterogeneous, which strongly influences on the wind field, temperature field, and turbulent field as well as the surface energy balance, distribution of water vapour and matter. In this study, using observation data of the Bowen ratio System to solve equations (4), (5), (6), (7) and (8), the latent heat flux, sensible heat flux and Bowen ratio value can be calculated. Therefore, the daily variation of the net radiation, sensible heat flux, latent heat flux and soil heat flux in autumn is shown as
![]()
Figure 10.
Analyzing land-atmospheric heat fluxes and energy balance characteristics during the mobile measurement, amplitude of the diurnal variation curve of the net radiation gradually decreases. The maximum value of the net radiation density also gradually decreases in accordance with the inclination of the sun elevation angle. Its maximum value regularly appears around 13:30, which is associated with the highest surface temperature, causing the radiation difference curve to be in an asymmetric form in the noon. The time in which the net radiation converts from a negative value to a positive one is gradually postponed and generally occurs at 1.5 h after the sunrise. Inversely, the time in which the net radiation converts from a positive value to a negative one is gradually advanced and mostly occurs at 1-1.5 h before the sunset. The main reason is associated to the time after sunrise that helps to absorb the shortwave radiation. When this value starts to exceed the effective radiation, the effective radiation exceeds the shortwave absorption radiation just begins at some time before sunset at dusk. The daily cumulation of the radiation balance gradually decreases month by month, indicating that the surface energy loss becomes also higher. Positive radiation balance during the daytime is about four times of the negative radiation balance during the night.
As shown in
The land with a higher vegetation coverage usually has a larger thermal inertia and capacity and a lower heat conduction and radiation. The heat storage volume of the concrete pavement and building surfaces are equivalent to 15%-30% of the net radiation. Moreover, the heat storage volume of the forest and grass grounds is only 5%-15% of the net radiation. As the sensible heat flux and Bowen ratio values of the urban artificial building land are higher than that of high-vegetation coverage area, the heat transfer from the underlying surface to atmosphere increases. Thus, urban artificial building land has a significant impact on the temperature field and heat island intensity. In addition, with the increase of urban impervious surface, the water capacity of ground rapidly decreases, the heating effect of latent heat flux weakens more gradually than that of sensible heat flux, the Bowen ratio value will increase with the growth of impervious surface area.
5 Discussion
The LULC type is the key factor for linking the thermal field, humidity field, and energy budget. The distribution patterns of the thermal and humidity fields have close relationships with LULC. There is a significant positive correlation between impervious surface area and thermal field intensity; thermal centers are mainly located in commercial areas, industrial districts, transportation junctions and other urban impervious surfaces; high humidity and low temperature areas are located in watery areas, areas with high vegetation coverage, and places with a low intensity of human activities. Concrete ground and lawns are the two most representative types of LULC, there are obvious differences in the characteristics of thermal and humidity fields, so the comparative observation experiments of energy budget were conducted on these two surfaces.
The results of cross validation show that the simulation precision of thermal and humidity fields is generally high based on the mobile observation, fixed-point observation and GIS spatial analysis methods.
Results indicate that the distributions of the thermal and humidity fields in Lanzhou have multiple centers and intensity level characteristics. With the rapid urbanization, urban construction land has expanded quickly. There is a close relationship between the structural characteristics of the thermal and humidity fields and the spatial distribution of urban impervious surface.
As mentioned previously, there are negative correlations between the NDVI value and thermal field intensity and positive correlations between the NDVI value and humidity field intensity. Therefore, it can be concluded that the higher vegetation coverage is, the lower the surface temperature, and the higher the relative humidity. With increasing of the artificial constructions in the city, vegetation is reduced, and the impervious surface area is increased. So, the water storage capacity is weakened, and as a result, humidity of the urban underlying surface becomes smaller. This implies that the reduction in the vegetation coverage and urban humidity causes the urban temperature to increase. Consistent with this study, relevant researches have shown that when the natural vegetation cover transforms into urban construction land type, a larger temperature variation is expected (
The urban impervious surface has a higher sensible heat flux and a lower latent heat flux, thus, its Bowen ratio value is high. On the contrary, there are a lower sensible heat flux and a higher latent heat flux in green space and water, and their Bowen ratio values are lower. The sensible heat flux and Bowen ratio values of the urban artificial building land are higher than that of high-vegetation coverage area, the heat transfer from the underlying surface to atmosphere increases. Thus, urban artificial building land has a significant impact on the thermal field and heat island intensity. The findings were in line with the prior studies,
6 Conclusions
Taking Lanzhou as a case of typical valley-city to monitor urban climate characteristics and their energy driving mechanism, mobile measurement, fixed-point measurement and GIS spatial analysis methods are used to simulate the spatial structure and dynamic evolution of temperature and humidity fields. LULC and NDVI are extracted from remote sensing images, the spatial structure relations between temperature field, humidity field, LULC and NDVI are analyzed. The land-atmospheric heat fluxes and energy balance are analyzed to explain the energy driving mechanism based on the Bowen-ratio System comparative experiments.
(1) Temperature and humidity fields have significant dynamic change within a day in autumn, and have multiple centers and multiple intensity levels characteristics. Urban thermal centers at 8:30 are located at the commerce and service industrial areas. The thermal centers at 14:30 are mainly distributed in the thermal power plant, and goods yard areas. The obvious thermal centers at 20:30 are located at the largest night market in Lanzhou, and all kinds of business activities like the night fairs and food stalls are more attractive during this time period. Low temperature areas are mainly distributed at the Yellow River beach with low development level and high vegetation coverage.
(2) The high humidity areas at 8:30 are mainly distributed in the east of the city, the humidity field is strong in the morning. Humidity patterns at 14:30 show dispersive distribution, and spatial difference of humidity is small. High humidity areas at 20:30 are mainly distributed at the Yellow River beach and the foothills of South Mountain. Low humidity areas are located at political, financial and commercial centers with high density of population and buildings. High humidity area and high vegetation coverage area are overlapped, and the size of relative humidity value is bound up with the thermal field intensity.
(3) The daily variations of the net radiation, sensible heat flux, latent heat flux and soil heat flux over urban heterogeneous surfaces are obvious, which drive the variations of temperature and humidity fields. Positive radiation budget during the daytime is about four times of negative radiation budget during the night. The building land has a higher sensible heat flux, a lower latent heat flux and a higher Bowen ratio value. Green space and waters have lower sensible heat flux, higher latent heat flux and lower Bowen ratio value. Sensible heat flux and Bowen ratio value of urban impervious surfaces are higher than that of high vegetation coverage area, it has a significant impact on the thermal field and the UHI intensity.
(4) The distribution patterns of temperature and humidity fields have close relationships with LULC and NDVI. There is a significant positive correlation between impervious surface area and thermal field intensity, thermal centers are mainly located in commercial areas, industrial districts and transportation junctions; high humidity and low temperature areas are located in watery areas, vegetated regions, and the places with a low intensity of human activities. A positive correlation between NDVI value and humidity field intensity has been found as well as a negative correlation between NDVI value and thermal field intensity.
References
[1] AkbariH, KolokotsaD. Three decades of urban heat islands and mitigation technologies research. Energy and Buildings, 133, 834-842(2016).
[2] ArndsD, B?hnerJ, BechtelB. Spatio-temporal variance and meteorological drivers of the urban heat island in a European city. Theoretical and Applied Climatology, 128, 43-61(2017).
[3] BenasN, ChrysoulakisN, CartalisC. Trends of urban surface temperature and heat island characteristics in the Mediterranean. Theoretical and Applied Climatology, 130, 807-816(2017).
[4] CaoW, Shao QQ, Liu JY et al. Impact of land use/land cover and its change on climate warming in Beijing area. Climatic and Environmental Research, 18, 451-460(2013).
[5] DavidE. Large-scale warming is not urban. Nature, 432, 290(2004).
[6] GaoJ, JiaoK, WuS. Investigating the spatially heterogeneous relationships between climate factors and NDVI in China during 1982 to 2013. Journal of Geographical Sciences, 29, 1597-1609(2019).
[8] Ho HC, KnudbyA, Xu YM et al. Comparison of urban heat islands mapped using skin temperature, air temperature, and apparent temperature (humidex), for the greater Vancouver area. Science of the Total Environment, 544, 929-938(2016).
[9] Jato-EspinoD. Spatiotemporal statistical analysis of the Urban Heat Island effect in a Mediterranean region. Sustainable Cities and Society, 46, 101427(2019).
[10] JinC, BaiX, LuoT et al. Effects of green roofs’ variations on the regional thermal environment using measurements and simulations in Chongqing, China. Urban Forestry & Urban Greening, 29, 223-237(2018).
[12] KourtidisK, Georgoulias AK, RapsomanikisS et al. A study of the hourly variability of the urban heat island effect in the Greater Athens Area during summer. Science of the Total Environment, 517, 162-177(2015).
[13] KuangW, DouY, ZhangC et al. Quantifying the heat flux regulation of metropolitan land use/land cover components by coupling remote sensing modeling with in situ measurement. Journal of Geophysical Research: Atmospheres, 120, 113-130(2015).
[14] KuangW, YangT, LiuA et al. An EcoCity model for regulating urban land cover structure and thermal environment: Taking Beijing as an example. Science China Earth Sciences, 60, 1098-1109(2017).
[15] KuangW, LiZ, HamdiR. Comparison of surface radiation and turbulent heat fluxes in Olympic Forest Park and on a building roof in Beijing, China. Urban Climate, 31, 100562(2020).
[16] Li GD, ZhangX, Mirzaei PA et al. Urban heat island effect of a typical valley city in China: Responds to the global warming and rapid urbanization. Sustainable Cities and Society, 38, 736-745(2018).
[17] LiX, Yang XQ, Tang JP et al. Multiple urban heat islands and surface energy balance during summer in Yangtze River Delta city cluster region simulated with WRF/NCAR. Journal of the Meteorological Sciences, 31, 441-450(2011).
[18] Li XQ, LuZ, Li YS. Study on the characteristics and driving mechanism of the heat island effect in Lanzhou. Journal of Lanzhou University (Natural Sciences), 52, 69-74(2016).
[19] LiuY, ShintaroG, Zhuang DF et al. Urban surface heat flux inversion based on infrared remote sensing and the relationship with land cover. Acta Geographica Sinica, 67, 101-112(2012).
[20] MaimaitijiangM, AlimujiangK. Study on land surface characteristics and its relationship with land surface thermal environment of typical city in arid region. Ecology and Environmental Sciences, 24, 1865-1871(2015).
[21] MarianiL, Parisi SG, ColaG et al. Climatological analysis of the mitigating effect of vegetation on the urban heat island of Milan, Italy. Science of the Total Environment, 569, 762-773(2016).
[22] Melaas KE, Wang AJ, Miller LD et al. Interactions between urban vegetation and surface urban heat islands: A case study in the Boston metropolitan region. Environmental Research Letters, 11, 054020(2016).
[23] Mirzaei PA, HaghighatF. Approaches to study urban heat island: Bilities and limitations. Building and Environment, 45, 2192-2201(2010).
[24] Pan JH, HanW. Urban expansion and its heat island response in Lanzhou city based on remote sensing analysis. Chinese Journal of Ecology, 30, 2597-2603(2011).
[25] PengZ, Liao HP, Guo YT. Influence of land cover change on land surface temperature in the mountainous city. Geographical Research, 28, 673-684(2009).
[26] QiJ, DingL, LimS. Ontology-based knowledge representation of urban heat island mitigation strategies. Sustainable Cities and Society, 52, 101875(2020).
[27] QinZ, KamieliA. A mono-window algorithm for retrieving land surface temperature from Landsat TM data and its application to the Israel-Egypt border region. International Journal of Remote Sensing, 22, 3719-3746(2002).
[28] RajasekarU, Weng QH. Spatio-temporal modelling and analysis of urban heat islands by using Landsat TM and ETM plus imagery. International Journal of Remote Sensing, 30, 3531-3548(2009).
[29] Rizwan AM, Dennis L YC, Liu CH. A review on the generation, determination and mitigation of urban heat island. Journal of Environment Sciences, 20, 120-128(2008).
[30] SchatzJ, Kucharik JC. Urban climate effects on extreme temperatures in Madison, Wisconsin, USA. Environmental Research Letters, 10, 094024(2015).
[31] ShaoQ, Sun CY, Liu JY et al. Impact of urban expansion on meteorological observation data and overestimation to regional air temperature in China. Acta Geographica Sinica, 64, 1292-1231(2009).
[32] Shirani-BidabadiN, NasrabadiT, FaryadiS et al. Evaluating the spatial distribution and the intensity of urban heat island using remote sensing, case study of Isfahan city in Iran. Sustainable Cities and Society, 45, 686-692(2019).
[33] Silva JS, Silva R MD, Santos C AG. Spatiotemporal impact of land use/land cover changes on urban heat islands: A case study of Paco do Lumiar, Brazil. Building and Environment, 136, 279-292(2018).
[34] SmallC. Comparative analysis of urban reflectance and surface temperature. Remote Sensing of Environment, 104, 168-189(2006).
[35] Sobrino JA, Jimenez-Munoz JC, PaoliniL. Land surface temperature retrieval from Landsat TM5. Remote Sensing of Environment, 90, 434-446(2004).
[36] Wang SW. Debating about the global warming. Chinese Science Bulletin, 55, 1529-1530(2010).
[37] WangW, ShuJ. Urban renewal can mitigate urban heat islands. Geophysical Research Letters, 47, 085948(2020).
[38] Yang SP, Lv SH, Chen YC. Simulation of afforestation effect on urban boundary layer structure of valley city in winter. Journal of Desert Research, 30, 691-698(2010).
[39] YuanL, ChenX, WangX et al. Spatial associations between NDVI and environmental factors in the Heihe River Basin. Journal of Geographical Sciences, 29, 1548-1564(2019).
[40] Zhang RH, TianJ, Li ZL et al. Principles and methods for the validation of quantitative remote sensing products. Science China: Earth Science, 40, 211-222(2010).
[41] ZhuC, LiS, JiP et al. Effects of the different width of urban green belts on the temperature and humidity. Acta Ecologica Sinica, 31, 383-394(2011).
[42] Zipper SC, SchatzJ, SinghA et al. Urban heat island impacts on plant phenology: Intra-urban variability and response to land cover. Environmental Research Letters, 11, 054023(2016).


Set citation alerts for the article
Please enter your email address

© Copyright 2018-2021 | Chinese Laser Press. All Rights Reserved 沪ICP备15018463号-20