• Acta Physica Sinica
  • Vol. 69, Issue 7, 074201-1 (2020)
Meng-Qi Li1、2, Yu-Jun Zhang1、*, Ying He1, Kun You1, Bo-Qiang Fan1、2, Dong-Qi Yu1、2, Hao Xie1、2, Bo-En Lei1、2, Xiao-Yi Li1, Jian-Guo Liu1、2, and Wen-Qing Liu1、2
Author Affiliations
  • 1Key Laboratory of Environmental Optics and Technology, Chinese Academy of Sciences, Anhui Institute of Optics and Fine Mechanics, Hefei 230031, China
  • 2University of Science and Technology of China, Hefei 230026, China
  • show less
    DOI: 10.7498/aps.69.20191832 Cite this Article
    Meng-Qi Li, Yu-Jun Zhang, Ying He, Kun You, Bo-Qiang Fan, Dong-Qi Yu, Hao Xie, Bo-En Lei, Xiao-Yi Li, Jian-Guo Liu, Wen-Qing Liu. NH3 aliasing absorption spectra at 1103.4 cm–1 based on continuous quantum cascade laser [J]. Acta Physica Sinica, 2020, 69(7): 074201-1 Copy Citation Text show less
    QCL characteristic measurement experimental device diagram.
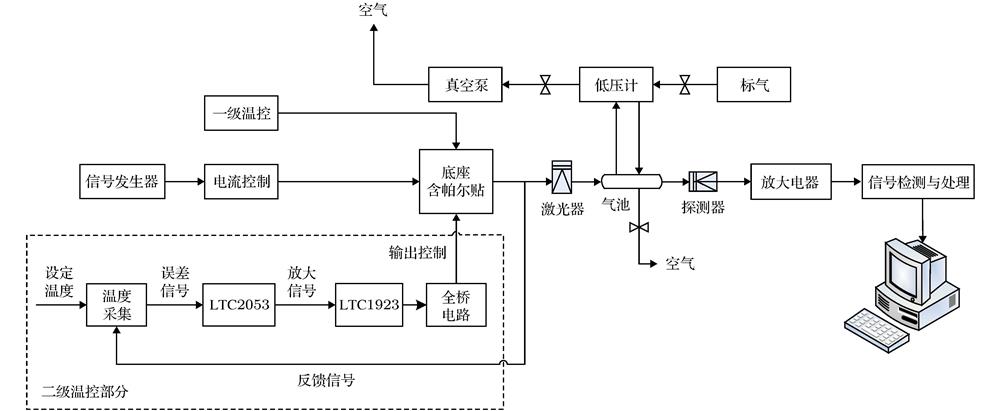
    Fig. 1. QCL characteristic measurement experimental device diagram.
    Experimental gas path diagram.
    Fig. 2. Experimental gas path diagram.
    (a) Signal drift without secondary temperature control; (b) signal stable output after adding temperature control
    Fig. 3. (a) Signal drift without secondary temperature control; (b) signal stable output after adding temperature control
    The temperature, current and wavelength of QCL
    Fig. 4. The temperature, current and wavelength of QCL
    (a) Characteristic absorption spectrum signal of ammonia gas under normal pressure; (b) characteristic absorption spectrum signal of ammonia gas under different pressure
    Fig. 5. (a) Characteristic absorption spectrum signal of ammonia gas under normal pressure; (b) characteristic absorption spectrum signal of ammonia gas under different pressure
    Fitting results of various absorption lines under different pressures.
    Fig. 6. Fitting results of various absorption lines under different pressures.
    Spectral line strength values of each absorption line measured by experiment.
    Fig. 7. Spectral line strength values of each absorption line measured by experiment.
    同位素 Isotopologue 波数 ν/cm–1线强 S/(cm–1/(molecule cm–2)) 空气展宽 γair/cm–1·atm–1自展宽 γself/cm–1·atm–1爱因斯坦系数 A/s–1
    14NH31103.430477.119 × 10200.08750.4527.183
    14NH31103.434326.131 × 10200.09330.5215.263
    14NH31103.441221.514 × 10–190.08180.3888.654
    14NH31103.469787.756 × 10200.07630.3289.694
    14NH31103.479518.172 × 10200.09940.5952.877
    14NH31103.485757.824 × 10200.0710.27410.32
    Table 1. NH3 absorption line and main parameters.
    v0/cm–1SH/cm–2atm–1SM/cm–2atm–1E/%
    1103.430471.783391.704394.43
    1103.434321.535891.463624.71
    1103.441223.792753.69012.71
    1103.469781.942971.878253.33
    1103.479512.047181.970893.73
    1103.485751.960011.883833.89
    Table 2.

    Comparison of experimental measurement line strength and HITRAN database.

    实验测量线强与HITRAN数据库对比分析

    积分吸光度的 不确定度 ΔA/% 压强的不 确定度 ΔP/% 浓度的不 确定度 Δm/% 光程的不 确定度 ΔL/% 温度的不 确定度 ΔT/% 线强的不 确定度 ΔS/%
    min2.420.150.20.20.12.44
    max8.928.93
    Table 3.

    Uncertainty in the measurement of the intensity of the overlapping spectral line.

    混叠光谱线强测量不确定度

    实验气压/ torr HITRAN数据库线强 反演浓度 m1/ppm 实验测量线强反演 浓度 m2/ppm m1与实际浓度 偏差/% m2与实际浓度 偏差/%
    3.2104.98102.554.982.55
    8.5103.89101.943.891.94
    12.6102.90101.402.901.40
    19.7103.08101.073.081.07
    25.4103.22101.003.221.00
    31.8106.23102.886.232.88
    90.7108.53104.918.534.91
    760108.86104.938.864.93
    Table 4.

    Contrast analysis of experimentally measured line strong inversion concentration and HITRAN database line strong inversion concentration.

    实验测量线强反演浓度与HITRAN数据库线强反演浓度作对比分析

    压力P/torr 反演浓度 m1, m2/ppm 标气浓度m/ppm
    3.28.512.619.725.4760
    151.68m1156.68155.32154.73154.79154.81159.62
    m2154.12153.54153.05152.77152.70155.48
    202.00m1207.13206.67205.14205.45205.86210.97
    m2205.25204.73204.29203.88203.82207.06
    250.34m1256.08255.03254.26254.45254.71260.25
    m2254.37253.79253.25252.91252.86256.61
    413.00m1420.47419.73418.18418.55418.94423.77
    m2419.65418.33417.61416.87416.76420.51
    Table 5.

    Comparison results of different pressure and standard gas concentrations.

    不同压力、标气浓度的比较结果

    Meng-Qi Li, Yu-Jun Zhang, Ying He, Kun You, Bo-Qiang Fan, Dong-Qi Yu, Hao Xie, Bo-En Lei, Xiao-Yi Li, Jian-Guo Liu, Wen-Qing Liu. NH3 aliasing absorption spectra at 1103.4 cm–1 based on continuous quantum cascade laser [J]. Acta Physica Sinica, 2020, 69(7): 074201-1
    Download Citation